13 KiB
Introduction to monitoring with Pandora FMS
Open source, all-purpose monitoring software monitors network equipment,
servers, virtual environments, applications, and much more.

Pandora Flexible Monitoring Solution (FMS) is all-purpose monitoring software, which means it can control network equipment, servers (Linux and Windows), virtual environments, applications, databases, and a lot more. It can do both remote monitoring and monitoring based on agents installed on the servers. You can get collected data in reports and graphs and raise alerts if something goes wrong.
Pandora FMS is offered in two versions: the open source community edition is aimed at private users and organizations of any size and is fully functional and totally free, while the enterprise version is designed to facilitate the work of companies, as it has support services and special features for large environments. Both versions are updated every month and accessible directly from the console.
Installing Pandora FMS
Getting started
Linux is the Pandora FMS's preferred operating system, but it also works perfectly under Windows. CentOS 7 is the recommended distribution, and there are installation packages in Debian/Ubuntu and SUSE Linux. If you feel brave, you can install it from source on other distros or FreeBSD or Solaris, but professional support is available only in Linux.
For a small test, you will need a server with at least 4GB of RAM and about 20GB of free disk space. With this environment, you can monitor 200 to 300 servers easily. Pandora FMS has different ways to scale, and it can monitor several thousand servers in a single instance. By combining several instances, clients with even 100,000 devices can be monitored.
ISO installation
The easiest way to install Pandora FMS is to use the ISO image, which contains a CentOS 7 version with all the dependencies. The following steps will get Pandora FMS ready to use in just five minutes.
- Download the ISO from Pandora FMS's website.
- Burn it onto a DVD or USB stick, or boot it from your virtual infrastructure manager (e.g., VMware, Xen, VirtualBox).
- Boot the image and proceed to the guided setup (a standard CentOS setup process). Set a unique password for the root user.
- Identify the IP address of your new system.
- Access the Pandora FMS console, using the IP address of the system where you installed Pandora FMS. Open a web browser and enter http://<pandora_ip_address>/pandora_console and log in as admin using the default password pandora.
Congratulations, you're in! You can skip the other installation methods and jump ahead to start monitoring something real.
Docker installation
- First, launch Pandora FMS with this command: [code]
curl -sSL http://pandorafms.org/getpandora | sh[/code] You can also run Pandora FMS as a container by executing: [code] docker run --rm -ti -p 80:80 -p 443:443
--name pandorafms pandorafms/pandorafms:latest
  2. Once Pandora FMS is running, open your browser and enter
**http://<ip address>/pandora_console**. Log in as **admin** with the default password **pandora**.


The Docker container is at [hub.docker.com/r/pandorafms/pandorafms][6].

### Yum installation

You can install Pandora FMS for Red Hat Enterprise Linux or CentOS 7 in just five steps.

  1. Activate CentOS Updates, CentOS Extras, and EPEL in [your repository's library][7].

  2. Add the official Pandora FMS repo to your system: [code] [artica_pandorafms]

name=CentOS7 - PandoraFMS official repo
baseurl=<http://firefly.artica.es/centos7>
gpgcheck=0
enabled=1
- Install the packages from the repo and solve all dependencies: [code]
yum install pandorafms_console pandorafms_server mariadb-server
  4. Reload services if you need to install Apache or MySQL/MariaDB: [code] service httpd reload (or equivalent)

service mysqld reload (or equivalent)
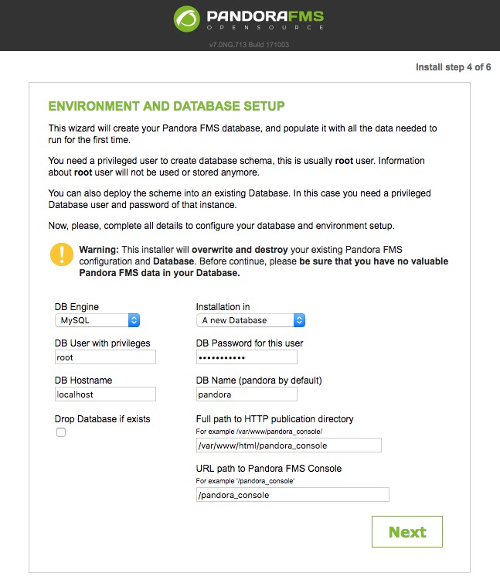
- Open your browser and enter http://<ip address>/pandora_console. Proceed with the setup process. After accepting the license and doing a few pre-checks, you should see something like this:
This screen is only needed when you install using the RPM, DEB, or source code (Git, tarball, etc.). This step of the console configuration uses MySQL credentials (which you need to know) to create a database and a username and password for Pandora FMS console and server. You need to set up the server password manually (yep! Vim or Nano?) by editing the /etc/pandora/pandora_server.conf file (follow the instructions in the documentation).
Restart the Pandora FMS server, and everything should be ready.
Other ways to install Pandora FMS
If none of these installation methods work with your setup, other options include a Git checkout, tarball with sources, DEB package (with the .deb online repo), and SUSE RPM. You can learn more about these installation methods in the installing wiki.
Grabbing the code is pretty easy with Git:
`git clone https://github.com/pandorafms/pandorafms.git`
Monitoring with Pandora FMS
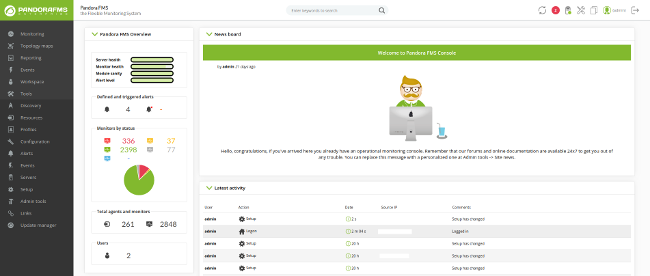
When you log into the console, you will see a welcome screen.
Monitoring something connected to the network
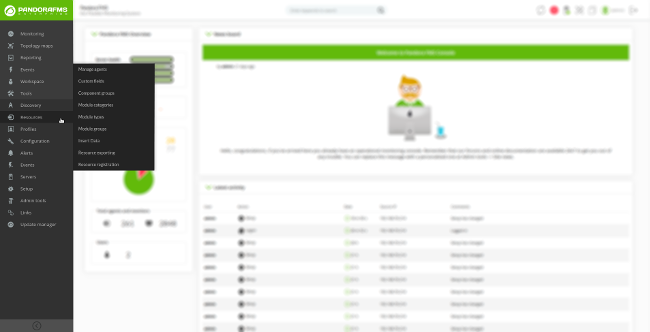
Let's begin with the most simple thing to do: ping to a host. First, create an agent by selecting Resources then Manage Agents from the menu.
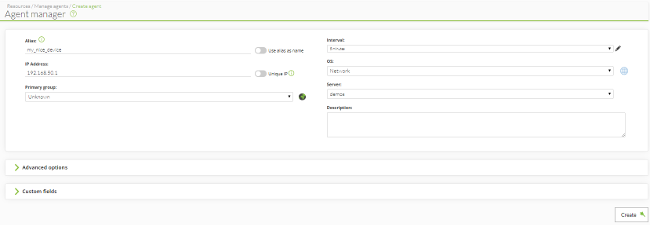
Click on Create at the bottom of the page, and fill the basic information (don't go crazy, just add your IP address and name).
Go to the Modules tab and create a network module.
Use the Module component (which comes from an internal library pre-defined in Pandora FMS) to choose the ping by selecting Network Management and entering Host Alive.
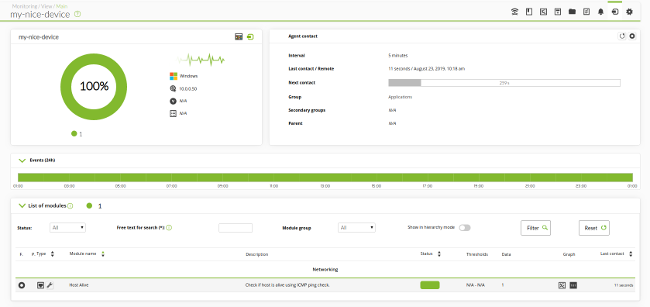
Click on Save and go back to the "view" interface by clicking the "eye" icon on the right.
Congratulations! Your ping is running (you know it because it's green).
This is the manual way; you can also use the wizard to grab an entire Simple Network Management Protocol (SNMP) device to show interfaces, or you can use a bulk operation to copy a configuration from one device to another, or you can use the command-line interface (CLI) API to do configurations automatically. Review the online wiki, with over 1200 articles of documentation, to learn more.
The following shows an old Sonicwall NSA 250M Firewall monitored with the SNMP wizard. It shows data on status interfaces, active connections, CPU usage, active VPN, and a lot more.
Remote monitoring supports SNMP v.1, 2, and 3; Windows Management Instrumentation (WMI); remote SSH calls; SNMP trap capturing; and NetFlow monitoring.
Monitoring a server with an agent
Installing a Linux agent in Red Hat/CentOS is simple. Enter:
`yum install pandorafms_agent_unix`
Edit /etc/pandora/pandora_agent.conf and set up the IP address of your Pandora FMS server:
`server_ip <x.x.x.x>`
Restart the agent and wait a few seconds for the console to show the data.
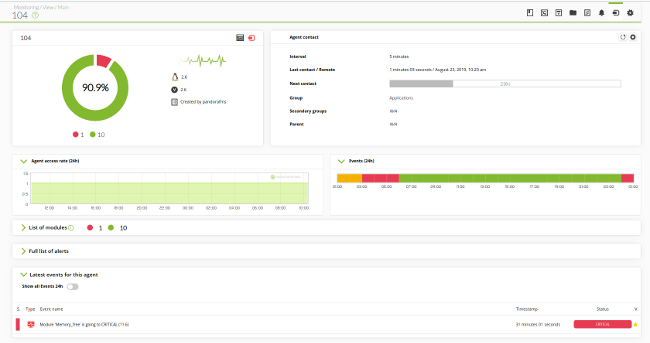
In the main agent view, you can see events, data, and history; define the threshold for status change; and set up alerts to warn you when something is wrong. Months worth of data is available for graphs, reports, and service-level agreement (SLA) compliance.
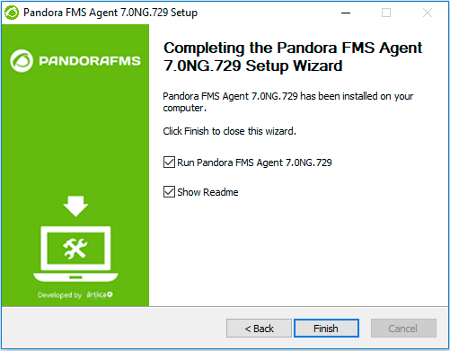
Installing a Windows agent is even easier because the installer supports automation for unattended setups. Start by downloading the agent and doing some usual routines. At some point, it will ask you for your server IP and the name for the agent, but that's all.
Windows agents support grabbing service status and processes, executing local commands to get information, getting Windows events, native WMI calls, obtaining performance counters directly from the system, and providing a lot more information than the basic CPU/RAM/disk stuff. It uses the same configuration file as the Linux version (pandora_agent.conf), which you can edit with a text editor like Notepad. Editing is very easy; you should be able to add your own checks in less than a minute.
Creating graphs, reports, and SLA checks
Pandora FMS has lots of options for graphs and reports, including on SLA compliance, in both the open source and enterprise versions.
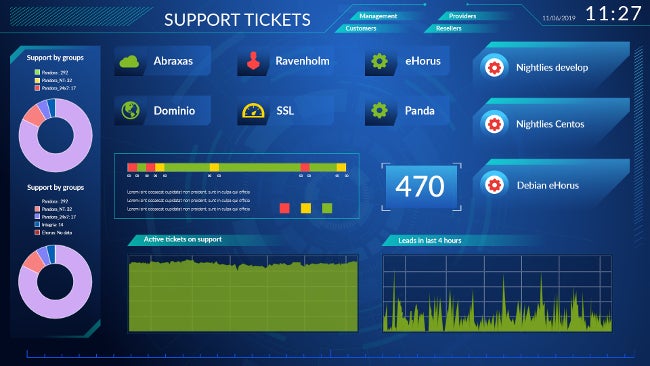
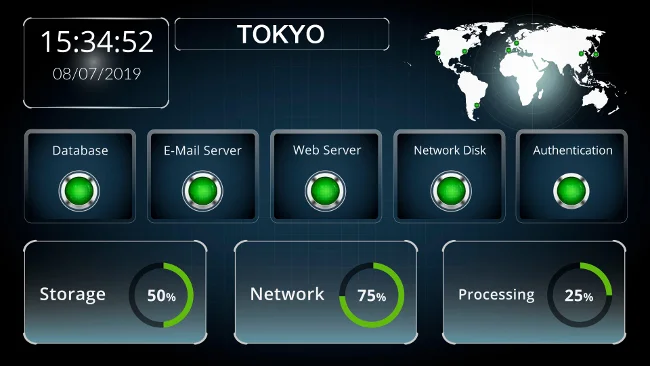
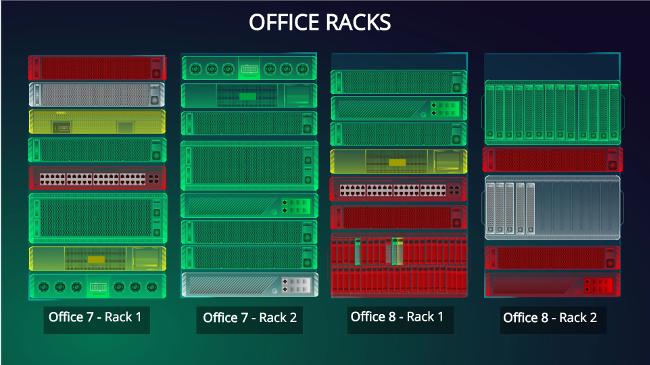
Pandora FMS's Visual Map feature allows you to create a map of information that combines status, data, graphs, icons, and more. You can edit it using an online editor. Pandora FMS is 100% operable from the console; no desktop application or Java is needed, nor do you need to execute commands from the console.
Here are three examples.
If you would like to learn more about Pandora FMS, visit the website or ask questions in the forum.
via: https://opensource.com/article/19/9/introduction-monitoring-pandora-fms
作者:Sancho Lerena 选题:lujun9972 译者:译者ID 校对:校对者ID
