6.3 KiB
hi ! 让我来翻译
How to debug a C/C++ program with Nemiver debugger
If you read my post on GDB, you know how important and useful a debugger I think can be for a C/C++ program. However, if a command line debugger like GDB sounds more like a problem than a solution to you, you might be more interested in Nemiver. Nemiver is a GTK+-based standalone graphical debugger for C/C++ programs, using GDB as its back-end. Admirable for its speed and stability, Nemiver is a very reliable debugger filled with goodies.
Installation of Nemiver
For Debian based distributions, it should be pretty straightforward:
$ sudo apt-get install nemiver
For Arch Linux:
$ sudo pacman -S nemiver
For Fedora:
$ sudo yum install nemiver
If you prefer compiling yourself, the latest sources are available from GNOME website.
As a bonus, it integrates very well with the GNOME environment.
Basic Usage of Nemiver
Start Nemiver with the command:
$ nemiver
You can also summon it with an executable with:
$ nemiver [path to executable to debug]
Note that Nemiver will be much more helpful if the executable is compiled in debug mode (the -g flag with GCC).
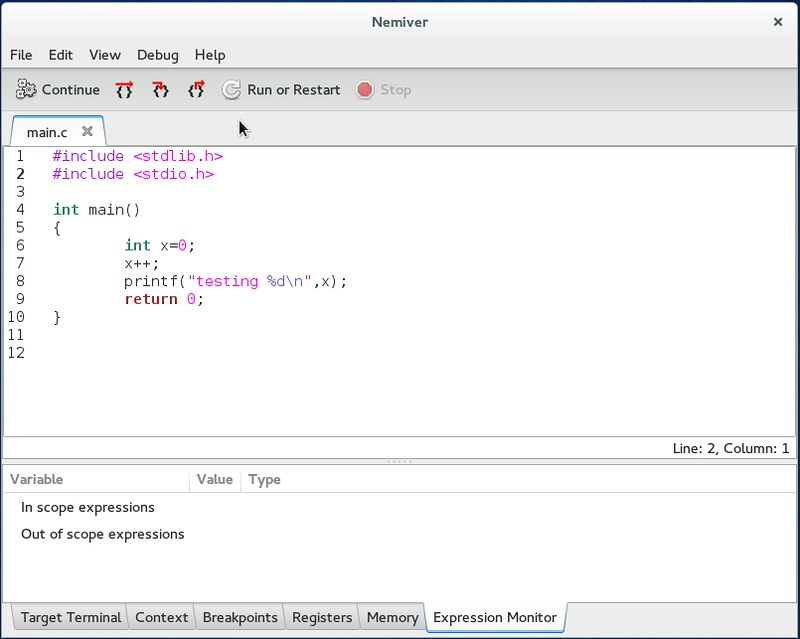
A good thing is that Nemiver is really fast to load, so you should instantly see the main screen in the default layout.
By default, a breakpoint has been placed in the first line of the main function. This gives you the time to recognize the basic debugger functions:
- Next line (mapped to F6)
- Step inside a function (F7)
- Step out of a function (Shift+F7)
But maybe my personal favorite is the option "Run to cursor" which makes the program run until a precise line under your cursor, and is by default mapped to F11.
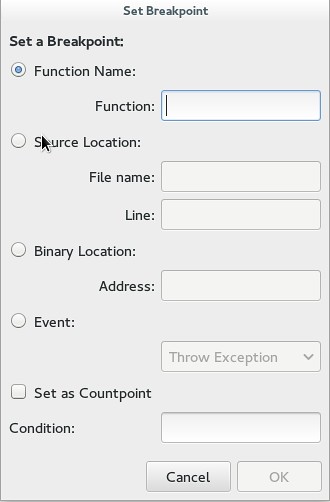
Next, the breakpoints are also easy to use. The quick way to lay a breakpoint at a line is using F8. But Nemiver also has a more complex menu under "Debug" which allows you to set up a breakpoint at a particular function, line number, location of binary file, or even at an event like an exception, a fork, or an exec.
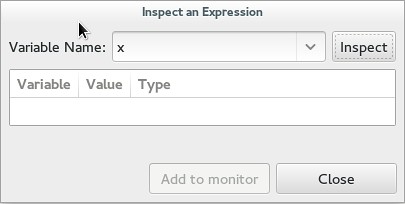
You can also watch a variable by tracking it. In "Debug" you can inspect an expression by giving its name and examining it. It is then possible to add it to the list of controlled variable for easy access. This is probably one of the most useful aspects as I have never been a huge fan of hovering over a variable to get its value. Note that hovering does work though. And to make it even better, Nemiver is capable of watching a struct, and giving you the values of all the member variables.
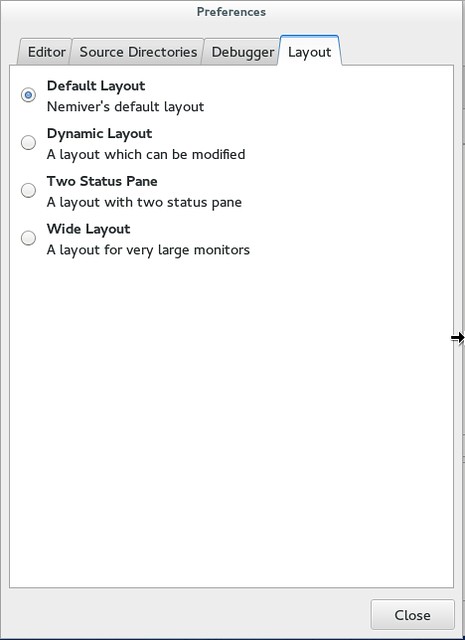
Talking about easy access to information, I also really appreciate the layout of the program. By default, the code is in the upper half and the tabs in the lower part. This grants you access to a terminal for output, a context tracker, a breakpoints list, register addresses, memory map, and variable control. But note that under "Edit" "Preferences" "Layout" you can select different layouts, including a dynamic one for you to modify.
And naturally, once you set up all your breakpoints, watch-points, and layout, you can save your session under “File” for easy retrieval in case you close Nemiver.
Advanced Usage of Nemiver
So far, we talked about the basic features of Nemiver, i.e., what you need to get started and debug simple programs immediately. If you have more advanced needs, and especially more complex programs, you might be more interested in some of these features mentioned here.
Debugging a running process
Nemiver allows you to attach to a running process for debugging. Under the "File" menu, you can filter the list of running processes, and connect to a process.
Debugging a program remotely over a TCP connection
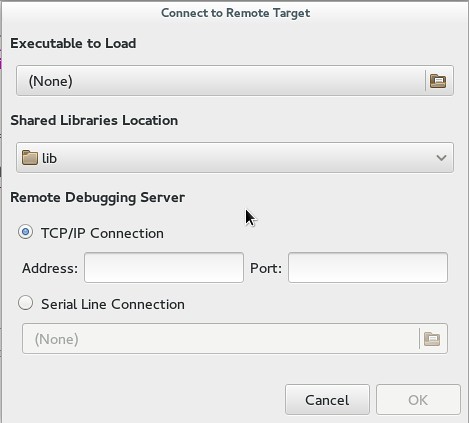
Nemiver supports remote-debugging, where you set up a lightweight debug server on a remote machine, and launch Nemiver from another machine to debug a remote target hosted by the debug server. Remote debugging can be useful if you cannot run full-fledged Nemiver or GDB on the remote machine for some reason. Under the "File" menu, specify the binary, shared library location, and the address and port.
Using your own GDB binary to debug
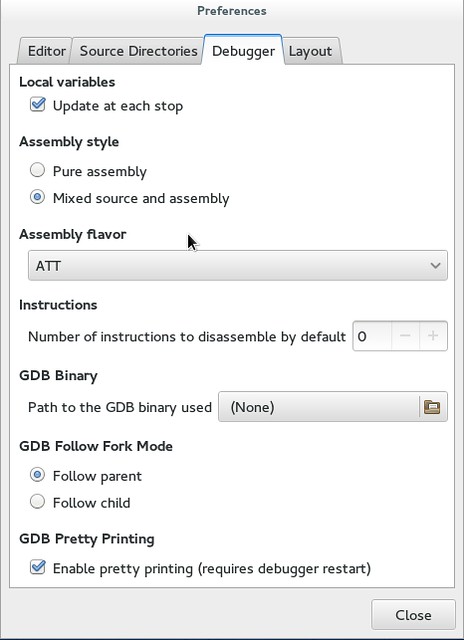
In case you compiled Nemiver yourself, you can specify a new location for GDB under "Edit" "Preferences" "Debug". This option can be useful if you want to use a custom version of GDB in Nemiver for some reason.
Follow a child or parent process
Nemiver is capable of following a child or parent process in case your program forks. To enable this feature, go to "Preferences" under "Debugger" tab.
To conclude, Nemiver is probably my favorite program for debugging without an IDE. It even beats GDB in my opinion, and command line programs generally have a good grip on me. So if you have never used it, I really recommend it. I can only congratulate the team behind it for giving us such a reliable and stable program.
What do you think of Nemiver? Would you consider it for standalone debugging? Or do you still stick to an IDE? Let us know in the comments.
via: http://xmodulo.com/debug-program-nemiver-debugger.html
作者:Adrien Brochard 译者:译者ID 校对:校对者ID
