21 KiB
Run Prometheus at home in a container
Keep tabs on your home network by setting up a Prometheus container
image.
Prometheus is an open source monitoring and alerting system that provides insight into the state and history of a computer, application, or cluster by storing defined metrics in a time-series database. It provides a powerful query language, PromQL, to help you explore and understand the data it stores. Prometheus also includes an Alertmanager that makes it easy to trigger notifications when the metrics you collect cross certain thresholds. Most importantly, Prometheus is flexible and easy to set up to monitor all kinds of metrics from whatever system you need to track.
As site reliability engineers (SREs) on Red Hat's OpenShift Dedicated team, we use Prometheus as a central component of our monitoring and alerting for clusters and other aspects of our infrastructure. Using Prometheus, we can predict when problems may occur by following trends in the data we collect from nodes in the cluster and services we run. We can trigger alerts when certain thresholds are crossed or events occur. As a data source for Grafana, Prometheus enables us to produce graphs of data over time to see how a cluster or service is behaving.
Prometheus is a strategic piece of infrastructure for us at work, but it is also useful to me at home. Luckily, it's not only powerful and useful but also easy to set up in a home environment, with or without Kubernetes, OpenShift, containers, etc. This article shows you how to build a Prometheus container image and set up the Prometheus Node Exporter to collect data from home computers. It also explains some basic PromQL, the query language Prometheus uses to return data and create graphs.
Build a Prometheus container image
The Prometheus project publishes its own container image, quay.io/prometheus/prometheus. However, I enjoy building my own for home projects and prefer to use the Red Hat Universal Base Image family for my projects. These images are freely available for anyone to use. I prefer the Universal Base Image 8 Minimal (ubi8-minimal) image based on Red Hat Enterprise Linux 8. The ubi8-minimal image is a smaller version of the normal ubi8 images. It is larger than the official Prometheus container image's ultra-sparse Busybox image, but since I use the Universal Base Image for other projects, that layer is a wash in terms of disk space for me. (If two images use the same layer, that layer is shared between them and doesn't use any additional disk space after the first image.)
My Containerfile for this project is split into a multi-stage build. The first, builder, installs a few tools via DNF packages to make it easier to download and extract a Prometheus release from GitHub, then downloads a specific release for whatever architecture I need (either ARM64 for my Raspberry Pi Kubernetes cluster or AMD64 for running locally on my laptop), and extracts it:
# The first stage build, downloading Prometheus from Github and extracting it

FROM registry.access.redhat.com/ubi8/ubi-minimal as builder
LABEL maintainer "Chris Collins <[collins.christopher@gmail.com][8]>"

# Install packages needed to download and extract the Prometheus release
RUN microdnf install -y gzip jq tar

# Replace the ARCH for different architecture versions, eg: "linux-arm64.tar.tz"
ENV PROMETHEUS_ARCH="linux-amd64.tar.gz"

# Replace "tag/<tag_name>" with "latest" to build whatever the latest tag is at the time
ENV PROMETHEUS_VERSION="tags/v2.27.0"
ENV PROMETHEUS="<https://api.github.com/repos/prometheus/prometheus/releases/${PROMETHEUS\_VERSION}>"

# The checksum file for the Prometheus project is "sha256sums.txt"
ENV SUMFILE="sha256sums.txt"

RUN mkdir /prometheus
WORKDIR /prometheus

# Download the checksum
RUN /bin/sh -c "curl -sSLf $(curl -sSLf ${PROMETHEUS} -o - | jq -r '.assets[] | select(.name|test(env.SUMFILE)) | .browser_download_url') -o ${SUMFILE}"

# Download the binary tarball
RUN /bin/sh -c "curl -sSLf -O $(curl -sSLf ${PROMETHEUS} -o - | jq -r '.assets[] | select(.name|test(env.PROMETHEUS_ARCH)) |.browser_download_url')"

# Check the binary and checksum match
RUN sha256sum --check --ignore-missing ${SUMFILE}

# Extract the tarball
RUN tar --extract --gunzip --no-same-owner --strip-components=1 --directory /prometheus --file *.tar.gz
The second stage of the multi-stage build copies the extracted Prometheus files to a pristine ubi8-minimal image (there's no need for the extra tools from the first image to take up space in the final image) and links the binaries into the $PATH:
# The second build stage, creating the final image
FROM registry.access.redhat.com/ubi8/ubi-minimal
LABEL maintainer "Chris Collins <[collins.christopher@gmail.com][8]>"
# Get the binary from the builder image
COPY --from=builder /prometheus /prometheus
WORKDIR /prometheus
# Link the binary files into the $PATH
RUN ln prometheus /bin/
RUN ln promtool /bin/
# Validate prometheus binary
RUN prometheus --version
# Add dynamic target (file_sd_config) support to the prometheus config
# <https://prometheus.io/docs/prometheus/latest/configuration/configuration/\#file\_sd\_config>
RUN echo -e "\n\
- job_name: 'dynamic'\n\
file_sd_configs:\n\
- files:\n\
- data/sd_config*.yaml\n\
- data/sd_config*.json\n\
refresh_interval: 30s\
" >> prometheus.yml
EXPOSE 9090
VOLUME ["/prometheus/data"]
ENTRYPOINT ["prometheus"]
CMD ["--config.file=prometheus.yml"]
Build the image:
# Build the Prometheus image from the Containerfile
podman build --format docker -f Containerfile -t prometheus
I'm using Podman as my container engine at home, but you can use Docker if you prefer. Just replace the podman command with docker above.
After building this image, you're ready to run Prometheus locally and start collecting some metrics.
Running Prometheus
# This only needs to be done once
# This directory will store the metrics Prometheus collects so they persist between container restarts
mkdir data

# Run Prometheus locally, using the ./data directory for persistent data storage
# Note that the image name, prometheus:latest, will be whatever image you are using
podman run --mount=type=bind,src=$(pwd)/data,dst=/prometheus/data,relabel=shared --publish=127.0.0.1:9090:9090 --detach prometheus:latest
The Podman command above runs Prometheus in a container, mounting the Data directory into the container and allowing you to access the Prometheus web interface with a browser only from the machine running the container. If you want to access Prometheus from other hosts, replace --publish=127.0.0.1:9090:9090 in the command with --publish=9090:9090.
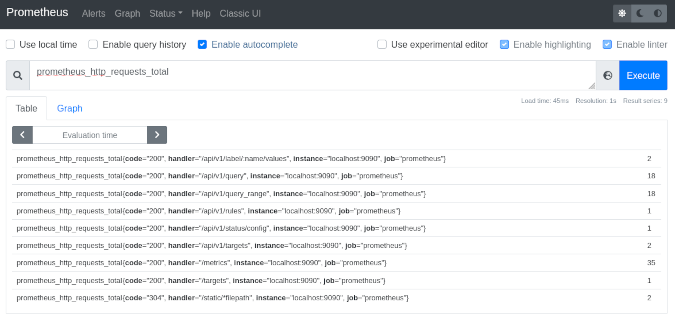
Once the container is running, you should be able to access Prometheus at http://127.0.0.1:9000/graph. There is not much to look at yet, though. By default, Prometheus knows only to check itself (the Prometheus service) for metrics related to itself. For example, navigating to the link above and entering a query for prometheus_http_requests_total will show how many HTTP requests Prometheus has received (most likely, just those you have made so far).
(Chris Collins, CC BY-SA 4.0)
This query can also be referenced as a URL:
`http://127.0.0.1:9090/graph?g0.expr=prometheus_http_requests_total&g0.tab=1&g0.stacked=0&g0.range_input=1h`
Clicking it should take you to the same results. By default, Prometheus scrapes for metrics every 15 seconds, so these metrics will update over time (assuming they have changed since the last scrape).
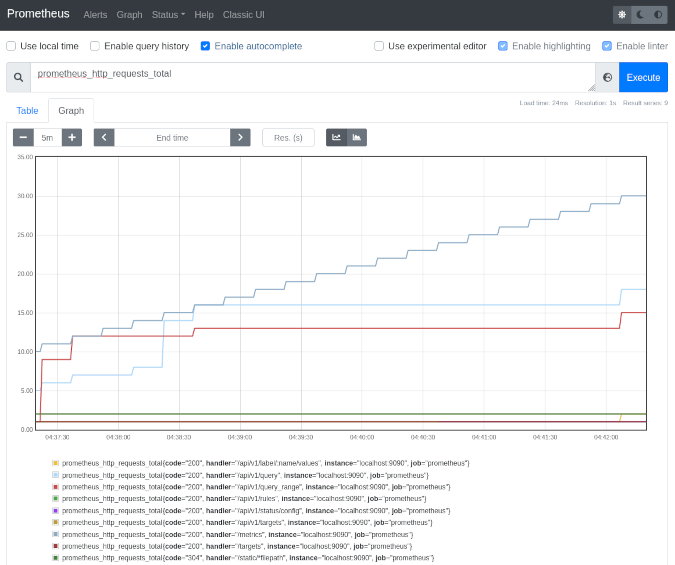
You can also graph the data over time by entering a query (as above) and clicking the Graph tab.
(Chris Collins, CC BY-SA 4.0)
Graphs can also be referenced as a URL:
`http://127.0.0.1:9090/graph?g0.expr=prometheus_http_requests_total&g0.tab=0&g0.stacked=0&g0.range_input=1h`
This internal data is not helpful by itself, though. So let's add some useful metrics.
Add some data
Prometheus—the project—publishes a program called Node Exporter for exporting useful metrics about the computer or node it is running on. You can use Node Exporter to quickly create a metrics target for your local machine, exporting data such as memory utilization and CPU consumption for Prometheus to track.
In the interest of brevity, just run the quay.io/prometheus/node-exporter:latest container image published by the Projetheus project to get started.
Run the following with Podman or your container engine of choice:
`podman run --net="host" --pid="host" --mount=type=bind,src=/,dst=/host,ro=true,bind-propagation=rslave --detach quay.io/prometheus/node-exporter:latest --path.rootfs=/host`
This will start a Node Exporter on your local machine and begin publishing metrics on port 9100. You can see which metrics are being generated by opening http://127.0.0.1:9100/metrics in your browser. It will look similar to this:
# HELP go_gc_duration_seconds A summary of the pause duration of garbage collection cycles.
# TYPE go_gc_duration_seconds summary
go_gc_duration_seconds{quantile="0"} 0.000176569
go_gc_duration_seconds{quantile="0.25"} 0.000176569
go_gc_duration_seconds{quantile="0.5"} 0.000220407
go_gc_duration_seconds{quantile="0.75"} 0.000220407
go_gc_duration_seconds{quantile="1"} 0.000220407
go_gc_duration_seconds_sum 0.000396976
go_gc_duration_seconds_count 2
Now you just need to tell Prometheus that the data is there. Prometheus uses a set of rules called scrape_configs that are defined in its configuration file, prometheus.yml, to decide what hosts to check for metrics and how often to check them. The scrape_configs can be set statically in the Prometheus config file, but that doesn't make Prometheus very flexible. Every time you add a new target, you would have to update the config file, stop Prometheus manually, and restart it. Prometheus has a better way, called file-based service discovery.
In the Containerfile above, there's a stanza adding a dynamic file-based service discovery configuration to the Prometheus config file:
RUN echo -e "\n\
  - job_name: 'dynamic'\n\
    file_sd_configs:\n\
    - files:\n\
      - data/sd_config*.yaml\n\
      - data/sd_config*.json\n\
      refresh_interval: 30s\
" >> prometheus.ym
This tells Prometheus to look for files named sd_config*.yaml or sd_config*.json in the Data directory that are mounted into the running container and to check every 30 seconds to see if there are more config files or if they have changed at all. Using files with that naming convention, you can tell Prometheus to start looking for other targets, such as the Node Exporter you started earlier.
Create a file named sd_config_01.json in the Data directory with the following contents, replacing your_hosts_ip_address with the IP address of the host running the Node Exporter:
`[{"labels": {"job": "node"}, "targets": ["your_hosts_ip_address:9100"]}`
Check http://127.0.0.1:9090/targets in Prometheus; you should see Prometheus monitoring itself (inside the container) and the target you added for the host with the Node Exporter. Click on the link for this new target to see the raw data Prometheus has scraped. It should look familiar:
# NOTE: Truncated for brevity
# HELP go_gc_duration_seconds A summary of the pause duration of garbage collection cycles.
# TYPE go_gc_duration_seconds summary
go_gc_duration_seconds{quantile="0"} 3.6547e-05
go_gc_duration_seconds{quantile="0.25"} 0.000107517
go_gc_duration_seconds{quantile="0.5"} 0.00017582
go_gc_duration_seconds{quantile="0.75"} 0.000503352
go_gc_duration_seconds{quantile="1"} 0.008072206
go_gc_duration_seconds_sum 0.029700021
go_gc_duration_seconds_count 55
This is the same data the Node Exporter is exporting:
`http://127.0.0.1:9090/graph?g0.expr=rate(node_network_receive_bytes_total%7B%7D%5B5m%5D)&g0.tab=0&g0.stacked=0&g0.range_input=15m`
With this information, you can create your own rules and instrument your own applications to provide metrics for Prometheus to consume.
A light introduction to PromQL
PromQL is Prometheus' query language and a powerful way to aggregate the time-series data stored in Prometheus. Prometheus shows you the output of a query as the raw result, or it can be displayed as a graph showing the trend of the data over time, like the node_network_receive_bytes_total example above. PromQL can be daunting to get into, and this article will not dive into a full tutorial on how to use it, but I will cover some basics.
To get started, pull up the query interface for Prometheus:
`http://127.0.0.1:9090/graph`
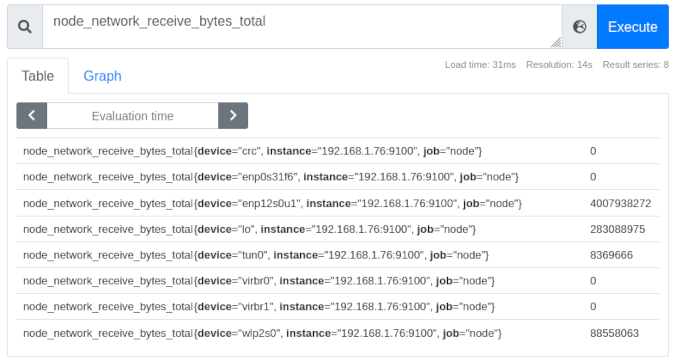
Look at the node_network_receive_bytes_total metrics in this example. Enter that string into the query field, and press Enter to display all the collected network metrics from the computer on which the Node Exporter is running. (Note that Prometheus provides an autocomplete feature, making it easy to explore the metrics it collects.) You may see several results, each with labels that have been applied to the data sent by the Node Exporter:
(Chris Collins, CC BY-SA 4.0)
Looking at the image above, you can see eight interfaces, each labeled by the device name (e.g., {device="ensp12s0u1"}), the instance they were collected from (in this case, all the same node), and the job node that was assigned in the sd_config_01.json. To the right of these is the latest raw metric data for this device. In the case of the ensp12s0u1 device, it's received 4007938272 bytes of data over the interface since Prometheus started tracking the data.
Note: The "job" label is useful in defining what kind of data is being collected. For example, "node" for metrics sent by the Node Exporter, or "cluster" for Kubernetes cluster data, or perhaps an application name for a specific service you may be monitoring.
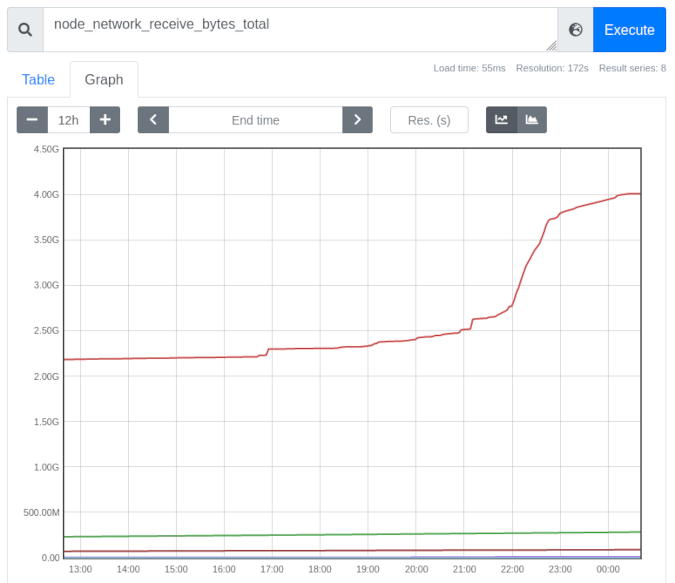
Click on the Graph tab, and you can see the metrics for these devices graphed over time (one hour by default). The time period can be adjusted using the - + toggle on the left. Historical data is displayed and graphed along with the current value. This provides valuable insight into how the data changes over time:
(Chris Collins, CC BY-SA 4.0)
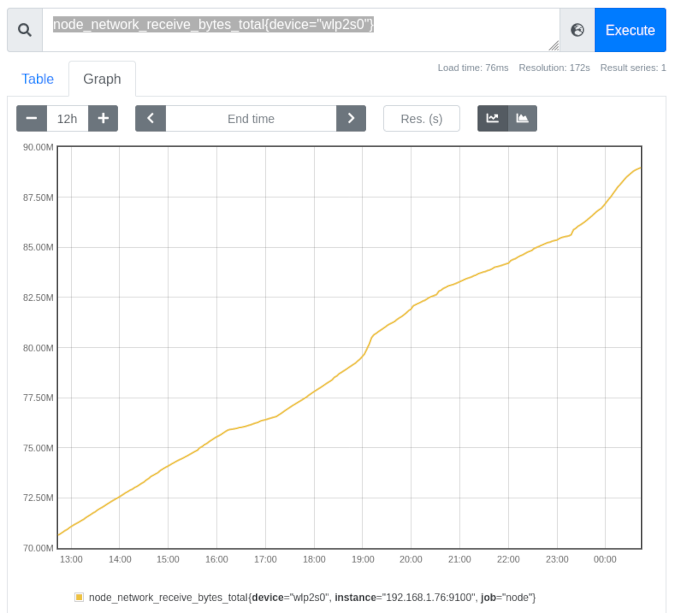
You can further refine the displayed data using the labels. This graph displays all the interfaces reported by the Node Exporter, but what if you are interested just in the wireless device? By changing the query to include the label node_network_receive_bytes_total{device="wlp2s0"}, you can evaluate just the data matching that label. Prometheus automatically adjusts the scale to a more human-readable one after the other devices' data is removed:
(Chris Collins, CC BY-SA 4.0)
This data is helpful in itself, but Prometheus' PromQL also has several query functions that can be applied to the data to provide more information. For example, look again at the rate() function. The rate() function "calculates the per-second average rate of increase of the time series in the range vector." That's a fancy way of saying "shows how quickly the data grew."
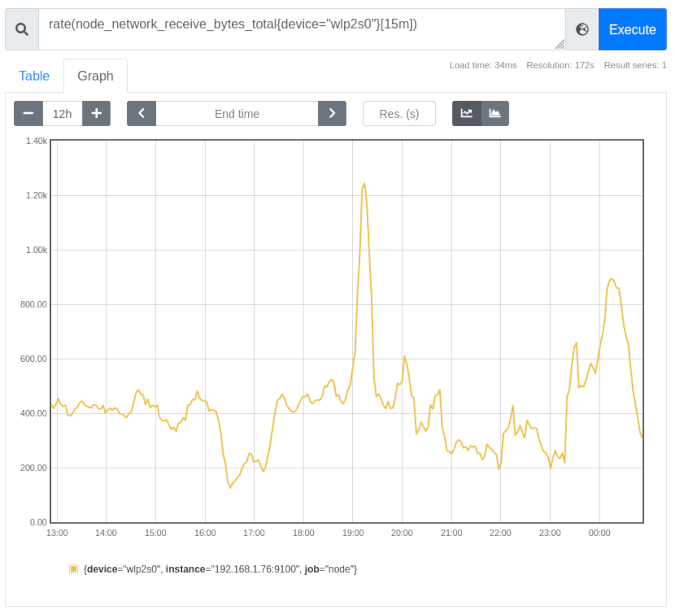
Looking at the graph for the wireless device above, you can see a slight curve—a slightly more vertical increase—in the line graph right around 19:00 hours. It doesn't look like much on its own but, using the rate() function, it is possible to calculate just how much larger the growth spike was around that timeframe. Using the query rate(node_network_receive_bytes_total{device="wlp2s0"}[15m]) shows the rate that the received bytes increased for the wireless device, averaged per second over a 15-minute period:
(Chris Collins, CC BY-SA 4.0)
It is much more evident that around 19:00 hours, the wireless device received almost three times as much traffic for a brief period.
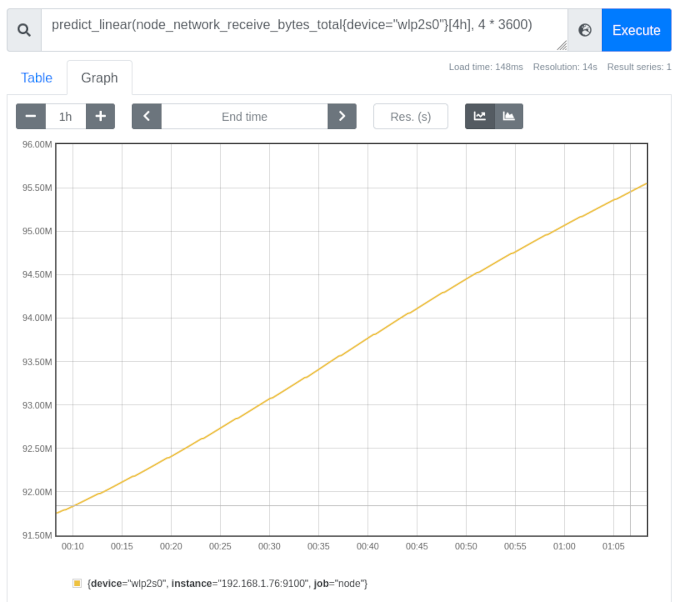
PromQL can do much more than this. Using the predict_linear() function, Prometheus can make an educated guess about when a certain threshold will be crossed. Using the same wireless network_receive_bytes data, you can predict where the value will be over the next four hours based on the data from the previous four hours (or any combination you might be interested in). Try querying predict_linear(node_network_receive_bytes_total{device="wlp2s0"}[4h], 4 * 3600).
The important bit of the predict_linear() function above is [4h], 4 * 3600. The [4h] tells Prometheus to use the past four hours as a dataset and then to predict where the value will be over the next four hours (or 4 * 3600 since there are 3,600 seconds in an hour). Using the example above, Prometheus predicts that the wireless device will have received almost 95MB of data about an hour from now (your data will vary):
(Chris Collins, CC BY-SA 4.0)
You can start to see how this might be useful, especially in an operations capacity. Kubernetes exports node disk usage metrics and includes a built-in alert using predict_linear() to estimate when a disk might run out of space. You can use all of these queries in conjunction with Prometheus' Alertmanager to notify you when various conditions are met—from network utilization being too high to disk space probably running out in the next four hours and more. Alertmanager is another useful topic that I'll cover in a future article.
Conclusion
Prometheus consumes metrics by scraping endpoints for specially formatted data. Data is tracked and can be queried for point-in-time info or graphed to show changes over time. Even better, Prometheus supports, out of the box, alerting rules that can hook in with your infrastructure in a variety of ways. Prometheus can also be used as a data source for other projects, like Grafana, to provide more sophisticated graphing information.
In the real world at work, we use Prometheus to track metrics and provide alert thresholds that page us when clusters are unhealthy, and we use Grafana to make dashboards of data we need to view regularly. We export node data to track our nodes and instrument our operators to track their performance and health. Prometheus is the backbone of all of it.
If you have been interested in Prometheus, keep your eyes peeled for follow-up articles. You'll learn about alerting when certain conditions are met, using Prometheus' built-in Alertmanager and integrations with it, more complicated PromQL, and how to instrument your own application and integrate it with Prometheus.
via: https://opensource.com/article/21/7/run-prometheus-home-container
作者:Chris Collins 选题:lujun9972 译者:译者ID 校对:校对者ID
