mirror of
https://github.com/LCTT/TranslateProject.git
synced 2024-12-29 21:41:00 +08:00
149 lines
9.4 KiB
Markdown
149 lines
9.4 KiB
Markdown
[#]: collector: (lujun9972)
|
|
[#]: translator: ( )
|
|
[#]: reviewer: ( )
|
|
[#]: publisher: ( )
|
|
[#]: subject: (How to test your network with PerfSONAR)
|
|
[#]: via: (https://opensource.com/article/18/11/how-test-your-network-perfsonar)
|
|
[#]: author: (Jessica Repka https://opensource.com/users/jrepka)
|
|
[#]: url: ( )
|
|
|
|
How to test your network with PerfSONAR
|
|
======
|
|
Set up a single-node configuration to measure your network performance.
|
|

|
|
|
|
[PerfSONAR][1] is a network measurement toolkit collection for testing and sharing data on end-to-end network perfomance.
|
|
|
|
The overall benefit of using network measurement tools like PerfSONAR is they can find issues before they become a large elephant in the room that nobody wants to talk about. Specifically, with the right answers from the right tools, patching can become more stringent, network traffic can be shaped to speed connections across the board, and the network infrastructure design can be improved.
|
|
|
|
PerfSONAR is licensed under the open source Apache 2.0 license, which makes it more affordable than most tools that do this type of analysis, a key advantage given constrained network infrastructure budgets.
|
|
|
|
### PerfSONAR versions
|
|
|
|
Several versions of PerfSONAR are available:
|
|
|
|
* **Perfsonar-tools:** The command line client version meant for on-demand testing.
|
|
* **Perfsonar-testpoint:** Adds automated testing and central management testing to PerfSONAR-tools. It has an archiving feature, but the archive must be set to an external node.
|
|
* **Perfsonar-core:** Includes everything in the testpoint software, but with local rather than external archiving.
|
|
* **Perfsonar-toolkit:** The core software; it includes a web UI with systemwide security settings.
|
|
* **Perfsonar-centralmanagement:** A completely separate version of PerfSONAR that uses mass grids of nodes to display results. It also has a feature to push out task templates to every node that is sending measurements back to the central host.
|
|
|
|
|
|
|
|
This tutorial will use **PerfSonar-toolkit** ; the tools used in this software include [iPerf, iPerf3][2], and [OWAMP][3].
|
|
|
|
### Requirements
|
|
|
|
* **Recommended operating system:** CentOS/RHEL7
|
|
* **ISO:** [Downloading][4] the full installation ISO is the fastest way to get the software up and running. While there is a [Debian version][5], it is much harder and more complicated to use.
|
|
* **Minimum hardware requirements:** 2 cores and 4GB RAM
|
|
* **Recommended hardware:** 200GB HDD, 4 cores, 6GB of RAM
|
|
|
|
|
|
|
|
### Installing and configuring PerfSONAR
|
|
|
|
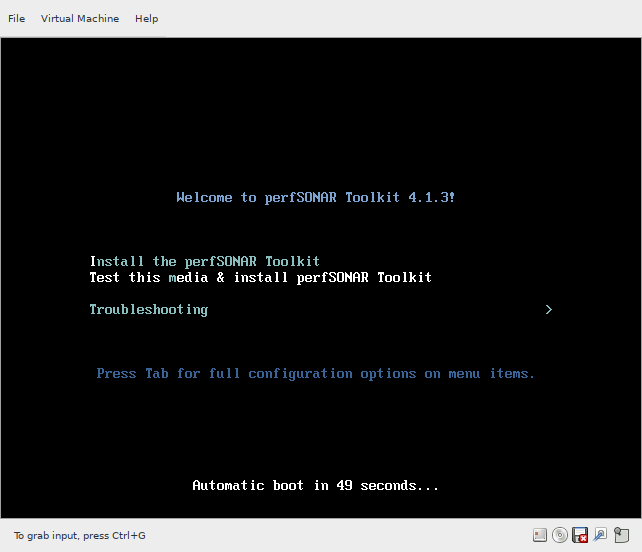
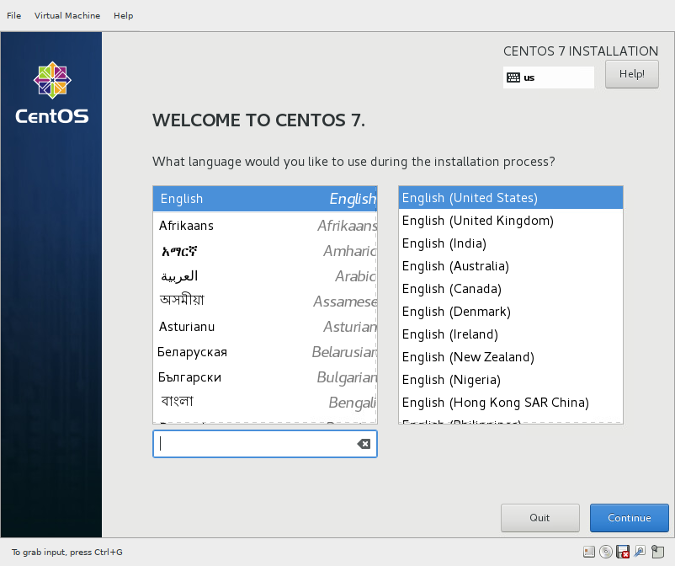
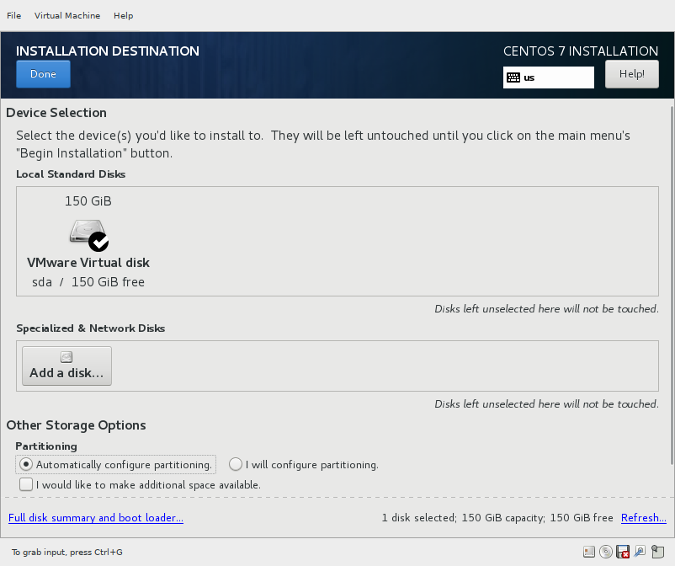
The installation is a quick CentOS install where you pick your timezone and configuration for the hard drive and user. I suggest using hard drive autoconfiguration, as you only need to choose "Install Toolkit" and follow the prompts from there.
|
|
|
|
Select your language.
|
|
|
|
Select a destination.
|
|
|
|
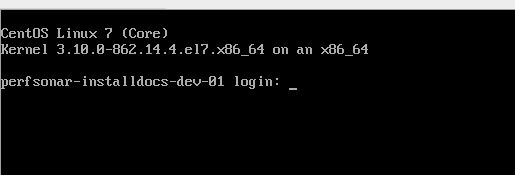
After base installation, you see the Linux login screen.
|
|
|
|
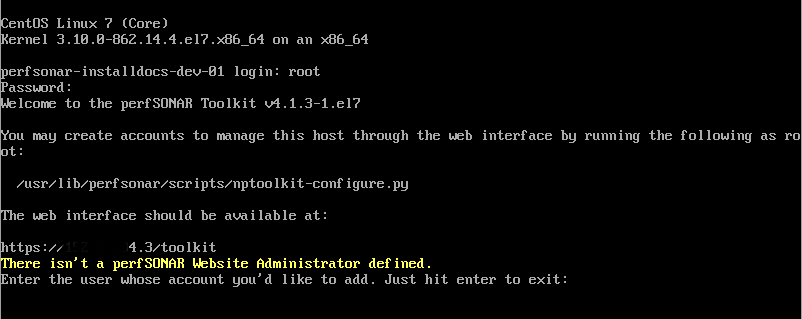
After you log in, you are prompted to create a user ID and password to log into PerfSONAR's web frontend—make sure to remember your login information.
|
|
|
|
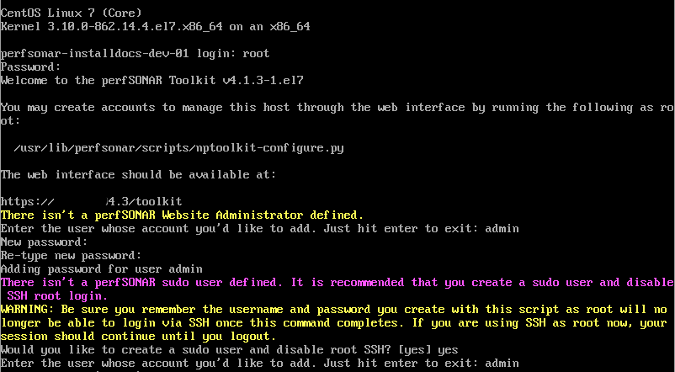
You're also asked to disable SSH access for root and create a new user for sudo; just follow the steps to create the new user.
|
|
|
|
You can use a provisioning service to automatically provide an IP address and hostname. Otherwise, you will have to set the hostname (optional) and configure the IP address.
|
|
|
|
### Log into the web frontend
|
|
|
|
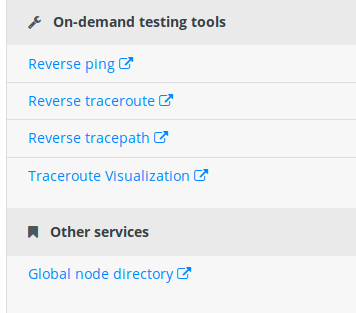
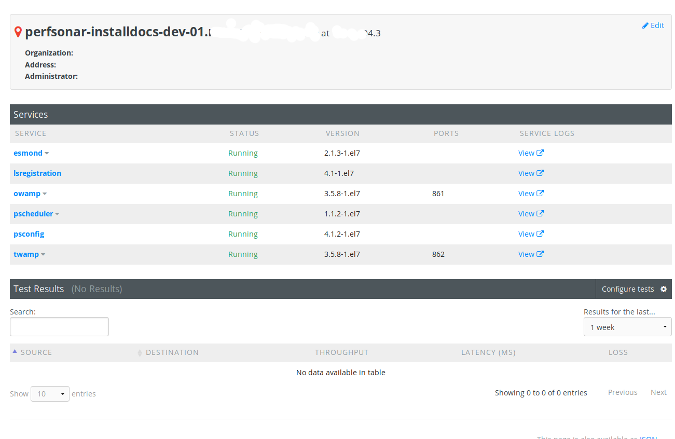
Once the base configuration is complete, you can log into the web frontend via **<http://ipaddress/toolkit>** or **<http://hostname/toolkit>**. The web frontend will appear with the name or IP address of the device you just set up, the list of tools used, a test result area, host information, global node directory, and on-demand testing.
|
|
|
|
These options appear on the right-hand side of the web page.
|
|
|
|
|
|
|
|
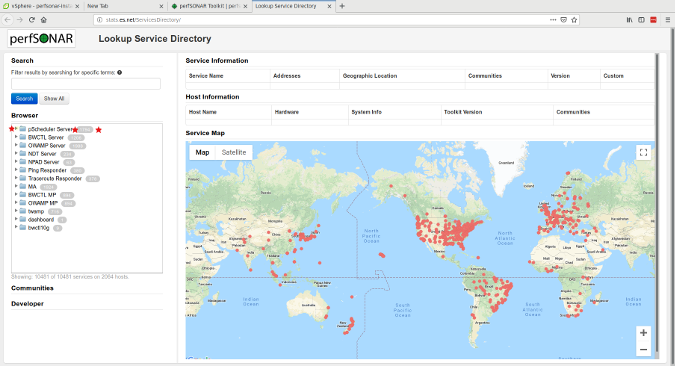
For a single configuration mode, you will need another node to test with. To get one, click on the global node [Lookup Service Directory][6] link, which will bring you to a list of available nodes.
|
|
|
|
|
|
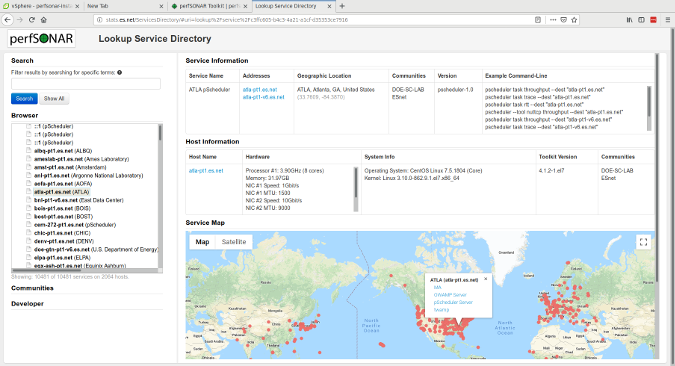
Pick an external node from the pScheduler Server list on the left. (I picked ESnet's Atlanta testing server.)
|
|
|
|
|
|
Configure the node by clicking the Log In button and entering the user ID and password you created during base configuration.
|
|

|
|
|
|
Next, choose Configuration.
|
|

|
|
|
|
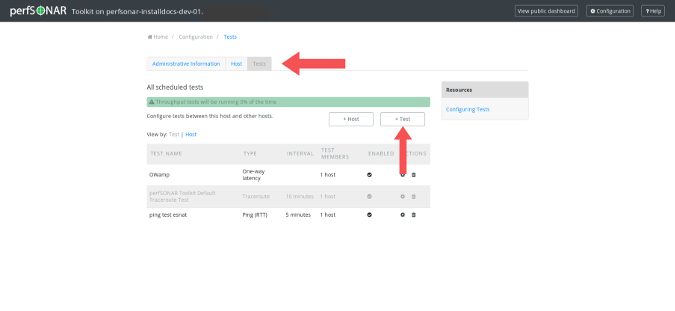
This takes you to the configuration page, where you can add tests to other nodes by clicking Test, then clicking +Test.
|
|
|
|
|
|
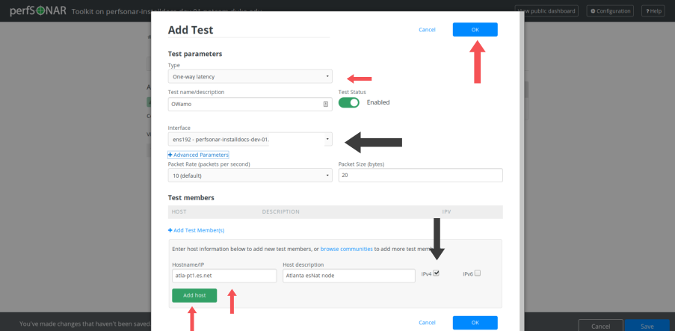
After you click +Test, you'll see a pop-up window with some drop-down options. For this tutorial, I used One-Way Active Measurement Protocol (OWAMP) testing for one-way latency against the ESnet Atlanta node that is IPv4.
|
|
|
|
#### Side bar
|
|
|
|
* The OWAMP measures unidirectional characteristics such as one-way delay and one-way loss. High-precision measurement of these one-way IP performance metrics became possible with wider availability of good time sources (such as GPS and CDMA). OWAMP enables the interoperability of these measurements.
|
|
* IPv4 is a fourth version of the Internet Protocol, which today is the main protocol to most of the internet. IPv4 protocol defines the rules for the operation of computer networks on the packet-exchange principle. This is a low-level protocol that is responsible for the connection between the nodes of the network on the basis of IP Addresses.
|
|
* The IPv4 node is a perfsonar testing node that only does network testing using the IPv4 protocols. The perfsonar testing node you connect to is the same application that is built in this documentation.
|
|
|
|
|
|
|
|
The drop-down should use the server's main interface. Confirm that the test is enabled (the Test Status switch will be green) and click the OK button at the bottom of the window.
|
|
|
|
|
|
Once you have added the test information, click the Save button at the bottom of the page.
|
|

|
|
|
|
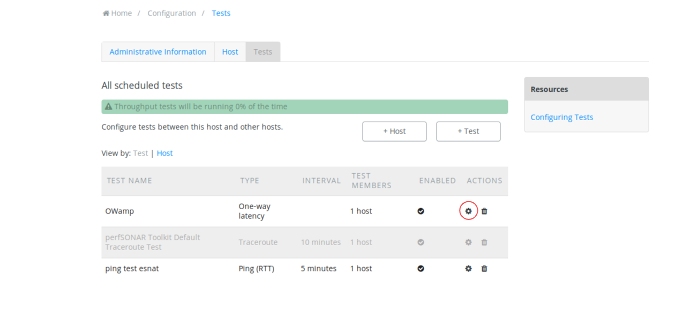
You will see information about all of the scheduled tests and the hosts they are testing. You can add more hosts to the test by clicking the Settings icon in the Actions column.
|
|
|
|
|
|
The testing intervals are automatically set according to the recommended settings. If the test frequency increases, the tests will still run OK, but your hard drive may fill up with data more quickly.
|
|
|
|
Once the test finishes, click View Public Dashboard to see the data that's returned. Note that it may take anywhere from five minutes to several hours to access the first sets of data.
|
|

|
|
|
|
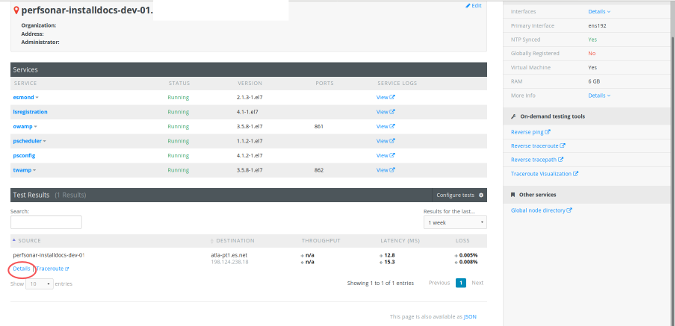
The public dashboard shows a high-level summary dataset. If you want more information, click Details.
|
|
|
|
|
|
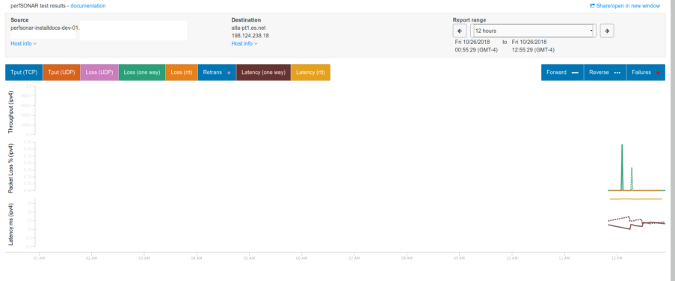
You'll see a larger graph and have the option to expand the graph over a year as data is collected.
|
|
|
|
|
|
PerfSONAR is now up, running, and testing the network. You can also test with two nodes inside your network (or one internal network node and one external node).
|
|
|
|
### What can you learn about your network?
|
|
|
|
In the time I've been using PerfSONAR, I've already uncovered the following issues:
|
|
|
|
* Asymmetrical throughput
|
|
* Fiber outages
|
|
* Speed on circuit not meeting contractual agreement
|
|
* Internal network slowdowns due to misconfigurations
|
|
* Incorrect routes
|
|
|
|
|
|
|
|
Have you used PerfSONAR or a similar tool? What benefits have you seen?
|
|
|
|
|
|
--------------------------------------------------------------------------------
|
|
|
|
via: https://opensource.com/article/18/11/how-test-your-network-perfsonar
|
|
|
|
作者:[Jessica Repka][a]
|
|
选题:[lujun9972][b]
|
|
译者:[译者ID](https://github.com/译者ID)
|
|
校对:[校对者ID](https://github.com/校对者ID)
|
|
|
|
本文由 [LCTT](https://github.com/LCTT/TranslateProject) 原创编译,[Linux中国](https://linux.cn/) 荣誉推出
|
|
|
|
[a]: https://opensource.com/users/jrepka
|
|
[b]: https://github.com/lujun9972
|
|
[1]: https://www.perfsonar.net/
|
|
[2]: https://iperf.fr/
|
|
[3]: http://software.internet2.edu/owamp/
|
|
[4]: http://downloads.perfsonar.net/toolkit/pS-Toolkit-4.1.3-CentOS7-FullInstall-x86_64-2018Oct24.iso
|
|
[5]: http://docs.perfsonar.net/install_options.html#
|
|
[6]: http://stats.es.net/ServicesDirectory/
|