mirror of
https://github.com/LCTT/TranslateProject.git
synced 2025-01-16 22:42:21 +08:00
261 lines
8.0 KiB
Markdown
261 lines
8.0 KiB
Markdown
translating by Flowsnow
|
||
|
||
How to use the Scikit-learn Python library for data science projects
|
||
======
|
||
|
||

|
||
|
||
The Scikit-learn Python library, initially released in 2007, is commonly used in solving machine learning and data science problems—from the beginning to the end. The versatile library offers an uncluttered, consistent, and efficient API and thorough online documentation.
|
||
|
||
### What is Scikit-learn?
|
||
|
||
[Scikit-learn][1] is an open source Python library that has powerful tools for data analysis and data mining. It's available under the BSD license and is built on the following machine learning libraries:
|
||
|
||
* **NumPy** , a library for manipulating multi-dimensional arrays and matrices. It also has an extensive compilation of mathematical functions for performing various calculations.
|
||
* **SciPy** , an ecosystem consisting of various libraries for completing technical computing tasks.
|
||
* **Matplotlib** , a library for plotting various charts and graphs.
|
||
|
||
|
||
|
||
Scikit-learn offers an extensive range of built-in algorithms that make the most of data science projects.
|
||
|
||
Here are the main ways the Scikit-learn library is used.
|
||
|
||
#### 1. Classification
|
||
|
||
The [classification][2] tools identify the category associated with provided data. For example, they can be used to categorize email messages as either spam or not.
|
||
|
||
* Support vector machines (SVMs)
|
||
* Nearest neighbors
|
||
* Random forest
|
||
|
||
|
||
|
||
#### 2. Regression
|
||
|
||
Classification algorithms in Scikit-learn include:
|
||
|
||
Regression involves creating a model that tries to comprehend the relationship between input and output data. For example, regression tools can be used to understand the behavior of stock prices.
|
||
|
||
Regression algorithms include:
|
||
|
||
* SVMs
|
||
* Ridge regression
|
||
* Lasso
|
||
|
||
|
||
|
||
#### 3. Clustering
|
||
|
||
The Scikit-learn clustering tools are used to automatically group data with the same characteristics into sets. For example, customer data can be segmented based on their localities.
|
||
|
||
Clustering algorithms include:
|
||
|
||
* K-means
|
||
* Spectral clustering
|
||
* Mean-shift
|
||
|
||
|
||
|
||
#### 4. Dimensionality reduction
|
||
|
||
Dimensionality reduction lowers the number of random variables for analysis. For example, to increase the efficiency of visualizations, outlying data may not be considered.
|
||
|
||
Dimensionality reduction algorithms include:
|
||
|
||
* Principal component analysis (PCA)
|
||
* Feature selection
|
||
* Non-negative matrix factorization
|
||
|
||
|
||
|
||
#### 5. Model selection
|
||
|
||
Model selection algorithms offer tools to compare, validate, and select the best parameters and models to use in your data science projects.
|
||
|
||
Model selection modules that can deliver enhanced accuracy through parameter tuning include:
|
||
|
||
* Grid search
|
||
* Cross-validation
|
||
* Metrics
|
||
|
||
|
||
|
||
#### 6. Preprocessing
|
||
|
||
The Scikit-learn preprocessing tools are important in feature extraction and normalization during data analysis. For example, you can use these tools to transform input data—such as text—and apply their features in your analysis.
|
||
|
||
Preprocessing modules include:
|
||
|
||
* Preprocessing
|
||
* Feature extraction
|
||
|
||
|
||
|
||
### A Scikit-learn library example
|
||
|
||
Let's use a simple example to illustrate how you can use the Scikit-learn library in your data science projects.
|
||
|
||
We'll use the [Iris flower dataset][3], which is incorporated in the Scikit-learn library. The Iris flower dataset contains 150 details about three flower species:
|
||
|
||
* Setosa—labeled 0
|
||
* Versicolor—labeled 1
|
||
* Virginica—labeled 2
|
||
|
||
|
||
|
||
The dataset includes the following characteristics of each flower species (in centimeters):
|
||
|
||
* Sepal length
|
||
* Sepal width
|
||
* Petal length
|
||
* Petal width
|
||
|
||
|
||
|
||
#### Step 1: Importing the library
|
||
|
||
Since the Iris dataset is included in the Scikit-learn data science library, we can load it into our workspace as follows:
|
||
|
||
```
|
||
from sklearn import datasets
|
||
iris = datasets.load_iris()
|
||
```
|
||
|
||
These commands import the **datasets** module from **sklearn** , then use the **load_digits()** method from **datasets** to include the data in the workspace.
|
||
|
||
#### Step 2: Getting dataset characteristics
|
||
|
||
The **datasets** module contains several methods that make it easier to get acquainted with handling data.
|
||
|
||
In Scikit-learn, a dataset refers to a dictionary-like object that has all the details about the data. The data is stored using the **.data** key, which is an array list.
|
||
|
||
For instance, we can utilize **iris.data** to output information about the Iris flower dataset.
|
||
|
||
```
|
||
print(iris.data)
|
||
```
|
||
|
||
Here is the output (the results have been truncated):
|
||
|
||
```
|
||
[[5.1 3.5 1.4 0.2]
|
||
[4.9 3. 1.4 0.2]
|
||
[4.7 3.2 1.3 0.2]
|
||
[4.6 3.1 1.5 0.2]
|
||
[5. 3.6 1.4 0.2]
|
||
[5.4 3.9 1.7 0.4]
|
||
[4.6 3.4 1.4 0.3]
|
||
[5. 3.4 1.5 0.2]
|
||
[4.4 2.9 1.4 0.2]
|
||
[4.9 3.1 1.5 0.1]
|
||
[5.4 3.7 1.5 0.2]
|
||
[4.8 3.4 1.6 0.2]
|
||
[4.8 3. 1.4 0.1]
|
||
[4.3 3. 1.1 0.1]
|
||
[5.8 4. 1.2 0.2]
|
||
[5.7 4.4 1.5 0.4]
|
||
[5.4 3.9 1.3 0.4]
|
||
[5.1 3.5 1.4 0.3]
|
||
```
|
||
|
||
Let's also use **iris.target** to give us information about the different labels of the flowers.
|
||
|
||
```
|
||
print(iris.target)
|
||
```
|
||
|
||
Here is the output:
|
||
|
||
```
|
||
[0 0 0 0 0 0 0 0 0 0 0 0 0 0 0 0 0 0 0 0 0 0 0 0 0 0 0 0 0 0 0 0 0 0 0 0 0
|
||
0 0 0 0 0 0 0 0 0 0 0 0 0 1 1 1 1 1 1 1 1 1 1 1 1 1 1 1 1 1 1 1 1 1 1 1 1
|
||
1 1 1 1 1 1 1 1 1 1 1 1 1 1 1 1 1 1 1 1 1 1 1 1 1 1 2 2 2 2 2 2 2 2 2 2 2
|
||
2 2 2 2 2 2 2 2 2 2 2 2 2 2 2 2 2 2 2 2 2 2 2 2 2 2 2 2 2 2 2 2 2 2 2 2 2
|
||
2 2]
|
||
|
||
```
|
||
|
||
If we use **iris.target_names** , we'll output an array of the names of the labels found in the dataset.
|
||
|
||
```
|
||
print(iris.target_names)
|
||
```
|
||
|
||
Here is the result after running the Python code:
|
||
|
||
```
|
||
['setosa' 'versicolor' 'virginica']
|
||
```
|
||
|
||
#### Step 3: Visualizing the dataset
|
||
|
||
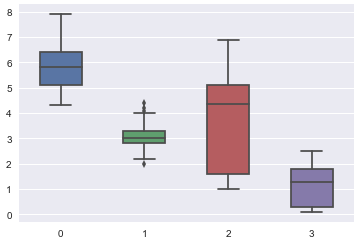
We can use the [box plot][4] to produce a visual depiction of the Iris flower dataset. The box plot illustrates how the data is distributed over the plane through their quartiles.
|
||
|
||
Here's how to achieve this:
|
||
|
||
```
|
||
import seaborn as sns
|
||
box_data = iris.data #variable representing the data array
|
||
box_target = iris.target #variable representing the labels array
|
||
sns.boxplot(data = box_data,width=0.5,fliersize=5)
|
||
sns.set(rc={'figure.figsize':(2,15)})
|
||
```
|
||
|
||
Let's see the result:
|
||
|
||

|
||
|
||
On the horizontal axis:
|
||
|
||
* 0 is sepal length
|
||
* 1 is sepal width
|
||
* 2 is petal length
|
||
* 3 is petal width
|
||
|
||
|
||
|
||
The vertical axis is dimensions in centimeters.
|
||
|
||
### Wrapping up
|
||
|
||
Here is the entire code for this simple Scikit-learn data science tutorial.
|
||
|
||
```
|
||
from sklearn import datasets
|
||
iris = datasets.load_iris()
|
||
print(iris.data)
|
||
print(iris.target)
|
||
print(iris.target_names)
|
||
import seaborn as sns
|
||
box_data = iris.data #variable representing the data array
|
||
box_target = iris.target #variable representing the labels array
|
||
sns.boxplot(data = box_data,width=0.5,fliersize=5)
|
||
sns.set(rc={'figure.figsize':(2,15)})
|
||
```
|
||
|
||
Scikit-learn is a versatile Python library you can use to efficiently complete data science projects.
|
||
|
||
If you want to learn more, check out the tutorials on [LiveEdu][5], such as Andrey Bulezyuk's video on using the Scikit-learn library to create a [machine learning application][6].
|
||
|
||
Do you have any questions or comments? Feel free to share them below.
|
||
|
||
--------------------------------------------------------------------------------
|
||
|
||
via: https://opensource.com/article/18/9/how-use-scikit-learn-data-science-projects
|
||
|
||
作者:[Dr.Michael J.Garbade][a]
|
||
选题:[lujun9972](https://github.com/lujun9972)
|
||
译者:[译者ID](https://github.com/译者ID)
|
||
校对:[校对者ID](https://github.com/校对者ID)
|
||
|
||
本文由 [LCTT](https://github.com/LCTT/TranslateProject) 原创编译,[Linux中国](https://linux.cn/) 荣誉推出
|
||
|
||
[a]: https://opensource.com/users/drmjg
|
||
[1]: http://scikit-learn.org/stable/index.html
|
||
[2]: https://blog.liveedu.tv/regression-versus-classification-machine-learning-whats-the-difference/
|
||
[3]: https://en.wikipedia.org/wiki/Iris_flower_data_set
|
||
[4]: https://en.wikipedia.org/wiki/Box_plot
|
||
[5]: https://www.liveedu.tv/guides/data-science/
|
||
[6]: https://www.liveedu.tv/andreybu/REaxr-machine-learning-model-python-sklearn-kera/oPGdP-machine-learning-model-python-sklearn-kera/
|