6.8 KiB
Linux FAQs with Answers--How to check memory usage on Linux
Question: I would like to monitor memory usage on my Linux system. What are the available GUI-based or command-line tools for checking current memory usage of Linux?
When it comes to optimizing the performance of a Linux system, physical memory is the single most important factor. Naturally, Linux offers a wealth of options to monitor the usage of the precious memory resource. Different tools vary in terms of their monitoring granularity (e.g., system-wide, per-process, per-user), interface (e.g., GUI, command-line, ncurses) or running mode (e.g., interactive, batch mode).
Here is a non-exhaustive list of GUI or command-line tools to choose from to check used and free memory on Linux platform.
1. /proc/meminfo
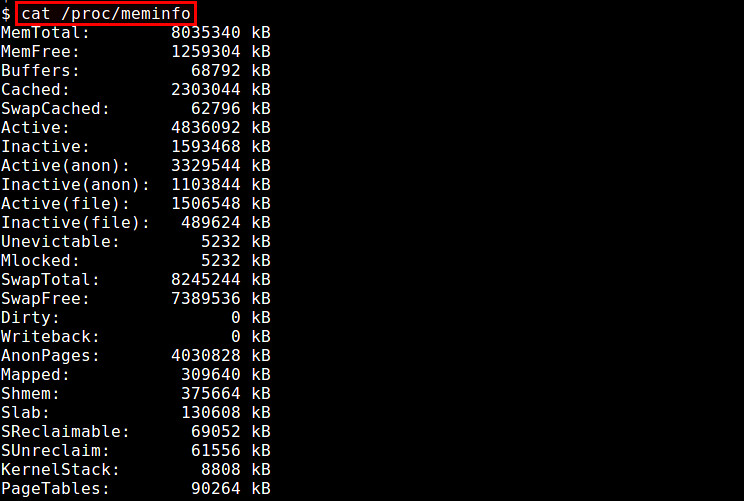
The simpliest method to check RAM usage is via /proc/meminfo. This dynamically updated virtual file is actually the source of information displayed by many other memory related tools such as free, top and ps tools. From the amount of available/free physical memory to the amount of buffer waiting to be or being written back to disk, /proc/meminfo has everything you want to know about system memory usage. Process-specific memory information is also available from /proc//statm and /proc//status
$ cat /proc/meminfo
2. atop
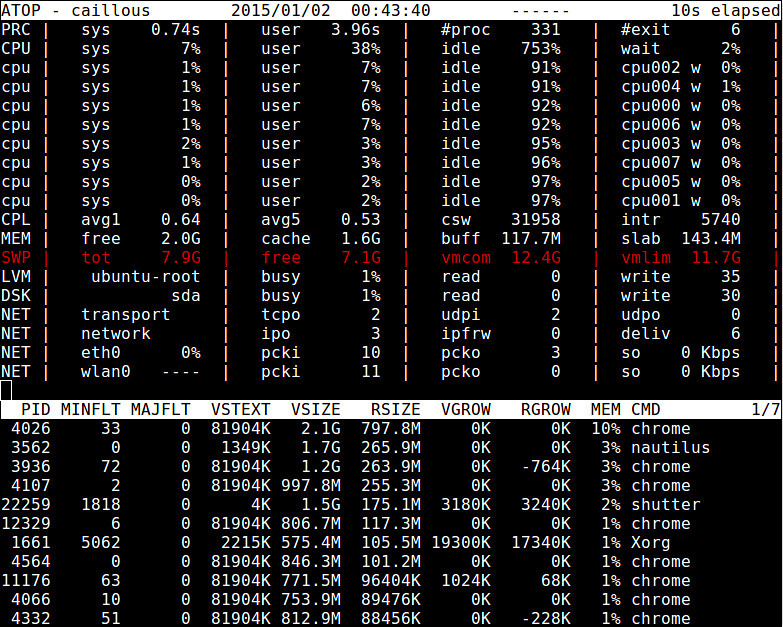
The atop command is an ncurses-based interactive system and process monitor for terminal environments. It shows a dynamically-updated summary of system resources (CPU, memory, network, I/O, kernel), with colorized warnings in case of high system load. It also offers a top-like view of processes (or users) along with their resource usage, so that system admin can tell which processes or users are responsible for system load. Reported memory statistics include total/free memory, cached/buffer memory and committed virtual memory.
$ sudo atop
3. free
The free command is a quick and easy way to get an overview of memory usage gleaned from /proc/meminfo. It shows a snapshot of total/free physical memory and swap space of the system, as well as used/free buffer space in the kernel.
$ free -h
4. GNOME System Monitor
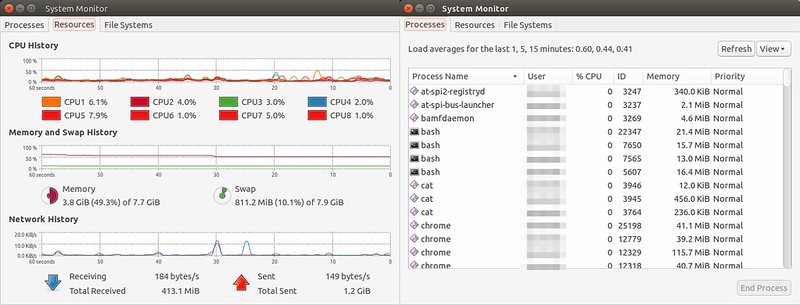
GNOME System Monitor is a GUI application that shows a short history of system resource utilization for CPU, memory, swap space and network. It also offers a process view of CPU and memory usage.
$ gnome-system-monitor
5. htop
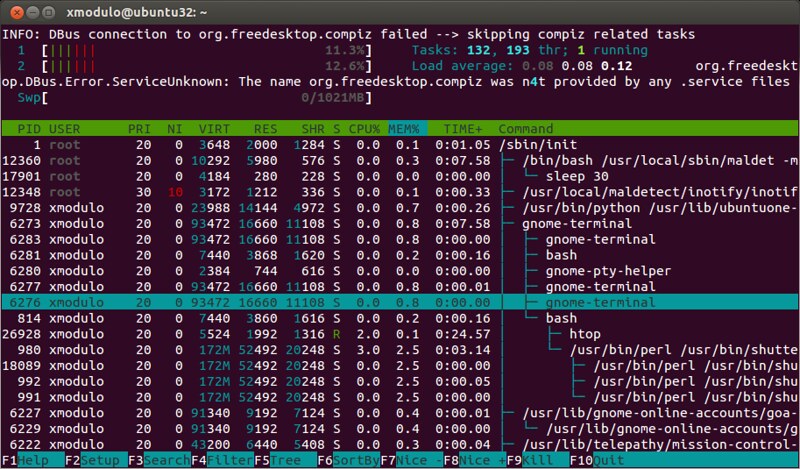
The htop command is an ncurses-based interactive processor viewer which shows per-process memory usage in real time. It can report resident memory size (RSS), total program size in memory, library size, shared page size, and dirty page size for all running processes. You can scroll the (sorted) list of processes horizontally or vertically.
$ htop
6. KDE System Monitor
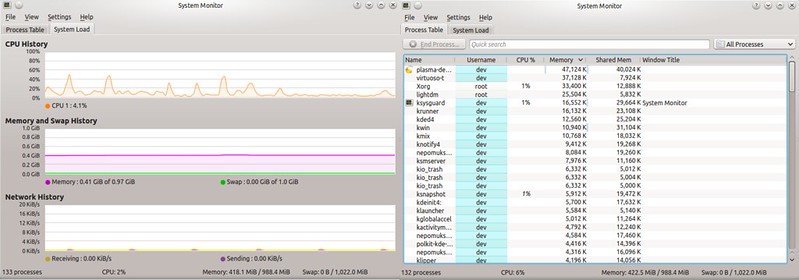
While GNOME desktop has GNOME System Monitor, KDE desktop has its own counterpart: KDE System Monitor. Its functionality is mostly similar to GNOME version, i.e., showing a real-time history of system resource usage, as well as a process list along with per-process CPU/memory consumption.
$ ksysguard
7. memstat
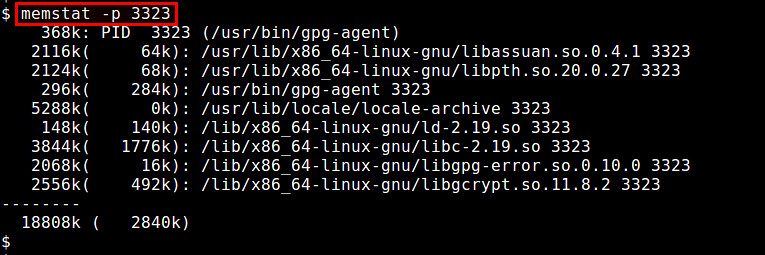
The memstat utility is useful to identify which executable(s), process(es) and shared libraries are consuming virtual memory. Given a process ID, memstat identifies how much virtual memory is used by the process' associated executable, data, and shared libraries.
$ memstat -p <PID>
8. nmon
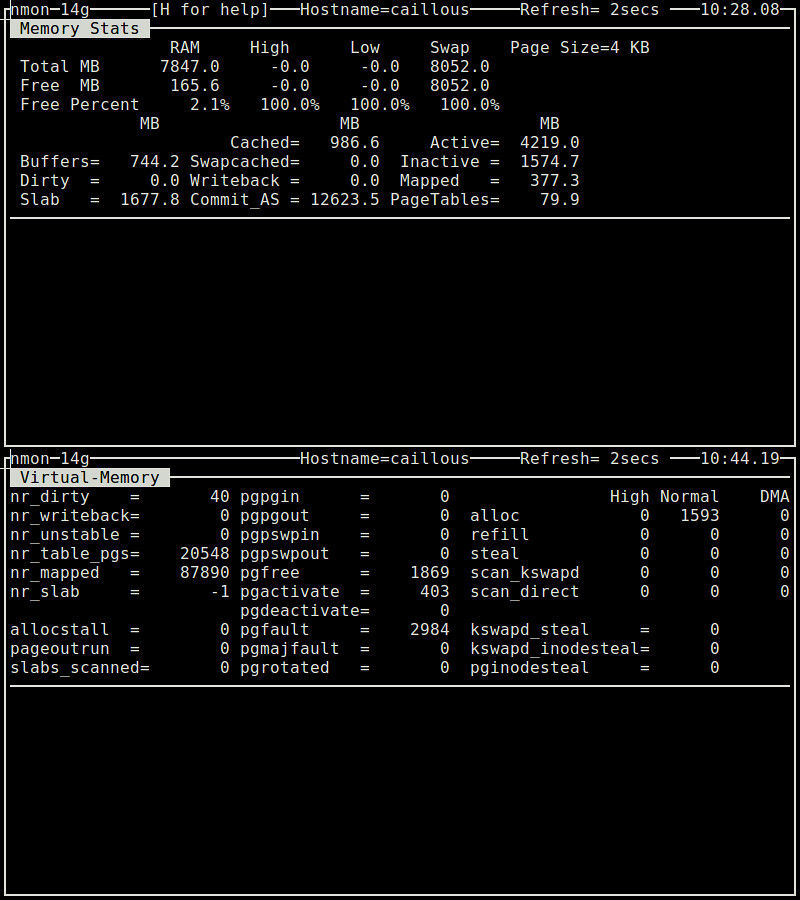
The nmon utility is an ncurses-based system benchmark tool which can monitor CPU, memory, disk I/O, kernel, filesystem and network resources in interactive mode. As for memory usage, it can show information such as total/free memory, swap space, buffer/cached memory, virtual memory page in/out statistics, all in real time.
$ nmon
9. ps
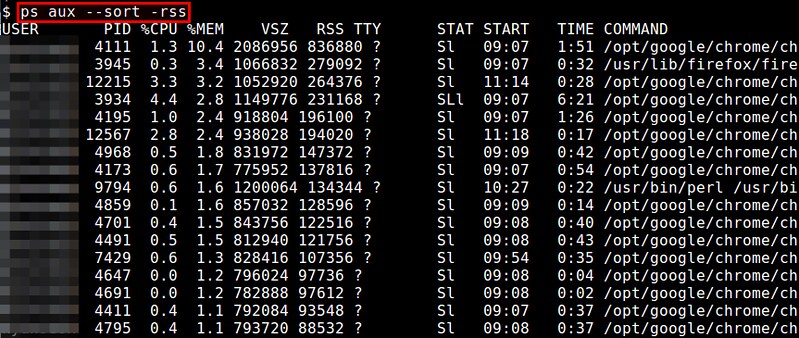
The ps command can show per-process memory usage in real-time. Reported memory usage information includes %MEM (percent of physical memory used), VSZ (total amount of virtual memory used), and RSS (total amount of physical memory used). You can sort the process list by using "--sort" option. For example, to sort in the decreasing order of RSS:
$ ps aux --sort -rss
10. smem
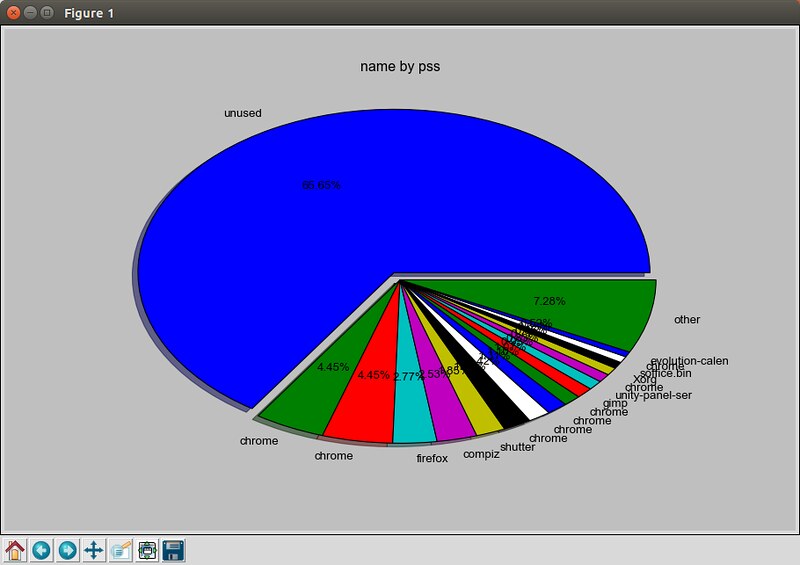
The smem command allows you to measure physical memory usage by different processes and users based on information available from /proc. It utilizes proportional set size (PSS) metric to accurately quantify effective memory usage of Linux processes. Memory usage analysis can be exported to graphical charts such as bar and pie graphs.
$ sudo smem --pie name -c "pss"
11. top
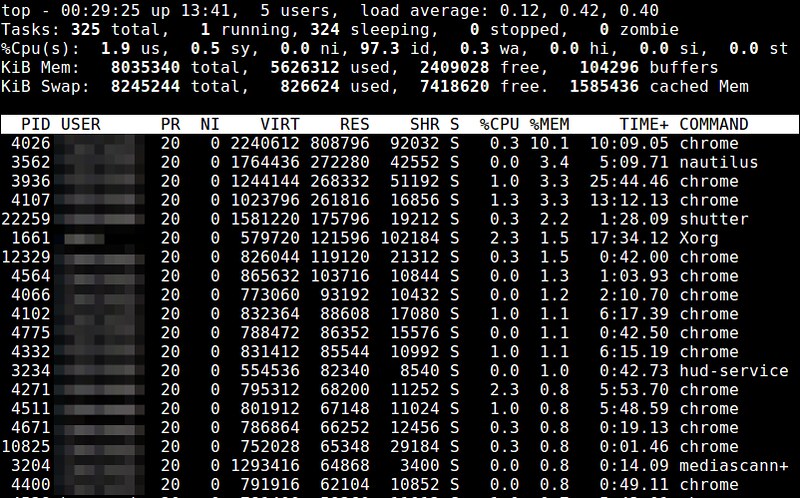
The top command offers a real-time view of running processes, along with various process-specific resource usage statistics. Memory related information includes %MEM (memory utilization percentage), VIRT (total amount of virtual memory used), SWAP (amount of swapped-out virtual memory), CODE (amount of physical memory allocated for code execution), DATA (amount of physical memory allocated to non-executable data), RES (total amount of physical memory used; CODE+DATA), and SHR (amount of memory potentially shared with other processes). You can sort the process list based on memory usage or size.
12. vmstat
The vmstat command-line utility displays instantaneous and average statistics of various system activities covering CPU, memory, interrupts, and disk I/O. As for memory information, the command shows not only physical memory usage (e.g., tota/used memory and buffer/cache memory), but also virtual memory statistics (e.g., memory paged in/out, swapped in/out).
$ vmstat -s
