10 KiB
How to use journalctl to View and Analyze Systemd Logs [With Examples]
This guide explains the basics of the journalctl utility of Systemd and its various commands. You can use these commands for troubleshooting desktop and server logs in Linux. This is how you can use journalctl to view and analyze Systemd Logs with different examples.
Introduction
Many say that Systemd is not good, it is heavy on the system and it is a debated topic always. But you can not deny that it provides a well set of utilities to manage, troubleshoot a system. Imagine you end up with a broken system with no GUI. You probably messed up boot and GRUB as well. In those kinds of scenarios or in general – you can boot from a LIVE system, mount your Linux partition and explore the Systemd logs to find out about the problem.
Systemd has three basic components as follows –
- systemd: System and service manager for Linux operating systems.
- systemctl: Command to introspect and control the state of the systemd system and service manager.
- systemd-analyze: Provides system boot-up performance statistics and retrieve other state and tracing information from the system and service manager
Apart from these three, there are additional services that systemd provides such as – journald, logind, networkd, etc. In this guide we will talk about the journald service of systemd.
journald – systemd journal daemon
By design, systemd provides a centralized way of handing all operating system logs from processes, applications, etc. All these logging events are handled by journald daemon of systemd. The journald daemon collects all logs from everywhere of the Linux operating systems and stores themes as binary data in files.
The advantages of centralized logging of events, system problems as binary data are many. For example, as the system logs are stored as binary and not text – you can translate in many ways such as text, JSON objects for various needs. Also, it is super easy to track down to a single event as the logs are stored sequentially via date/time manipulation of the logs.
Remember the log files that journald collects are in thousands of lines and it gets updated for every event, every boot. So if you have a long time running Linux operating system – the journal logs size should in GBs. As the logs are in thousands, it’s better to filter with basic commands to find out more about the system problems.
The journald Configuration File
The configuration file of the journald is present in the below path. It contains various flags on how the logging happens. You can take a look at the file and make the changes necessary. But I would recommend not to modify this file unless you know what you are doing.
/etc/systemd/journald.conf
Where journald stores the binary log files
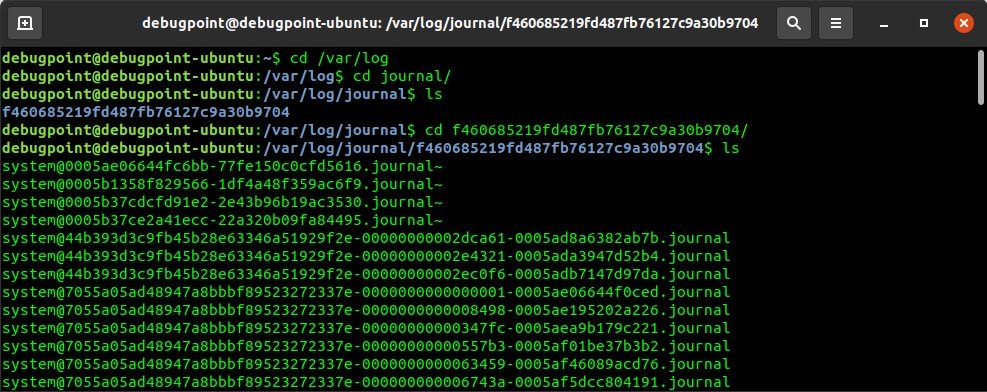
The journald stores the logs in binary format. They are stored inside a directory under this path.
/var/log/journal
For example, in the below path there is a directory that contains all the system logs to date.
Do not use cat command or use nano or vi to open these files. They would not be displayed properly.
Use journalctl to View and Analyze Systemd Logs
Basic journald command
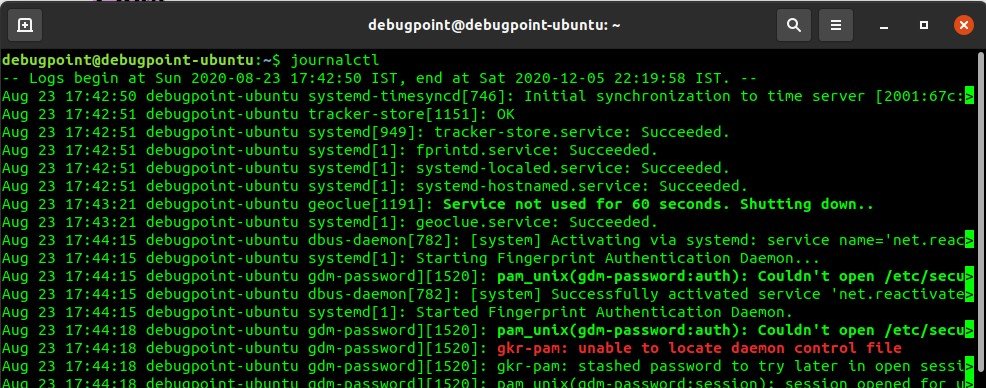
The basic command to view logs using journal daemon is –
journalctl
This gives you all the journal entries including errors, warnings, etc from all applications and processes. It shows the list with the oldest log at the top and current logs at the bottom. You need to keep pressing ENTER to scroll through it line by line. You can also use PAGE UP and PAGE DOWN keys to scroll. Press q to exit from this view.
How to view journal entries for time zones
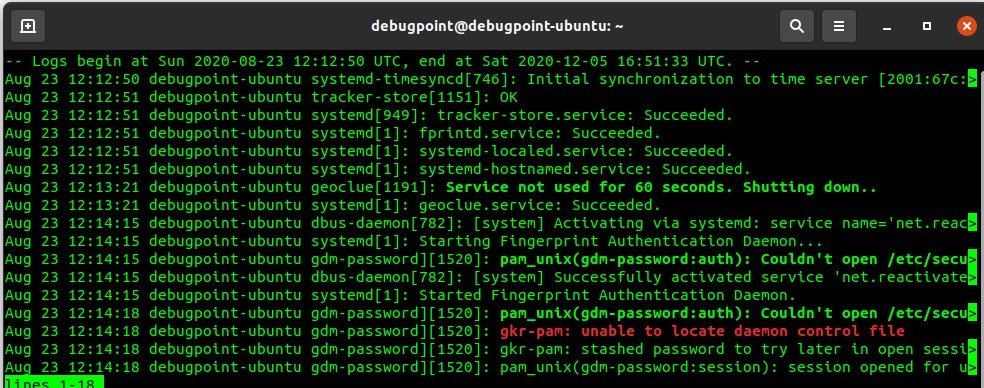
By default, the journalctl shows the log time in the current system time zone. However, you can easily provide the timezone in your command to convert the same log to a different time zone. For example, to view the logs in UTC, use the below command.
journalctl --utc
How to view only errors, warnings, etc in journal logs
The logs that a system generates have different priorities. Some logs may be a warning which can be ignored or some may be critical errors. You might want to look at only errors, not warnings. That is also possible using the below command.
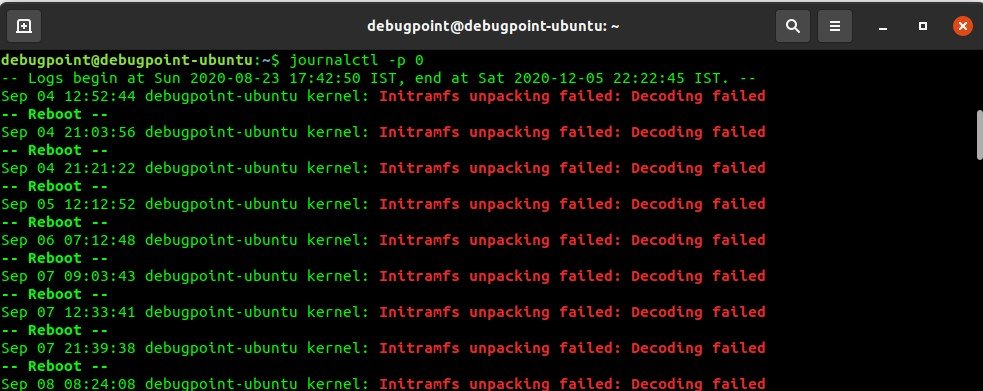
To view emergency system messages use:
journalctl -p 0
Error codes
0: emergency
1: alerts
2: critical
3: errors
4: warning
5: notice
6: info
7: debug
When you specify the error code, it shows all messages from that code and above. For example, if you specify the below command, it shows all messages with priority 2, 1 and 0
journalctl -p 2
How to view journal logs for a specific boot
When you are running the journalctl command it shows the information from the current boot that is from the current session which you are running. But it is also possible to view information about past boots as well.
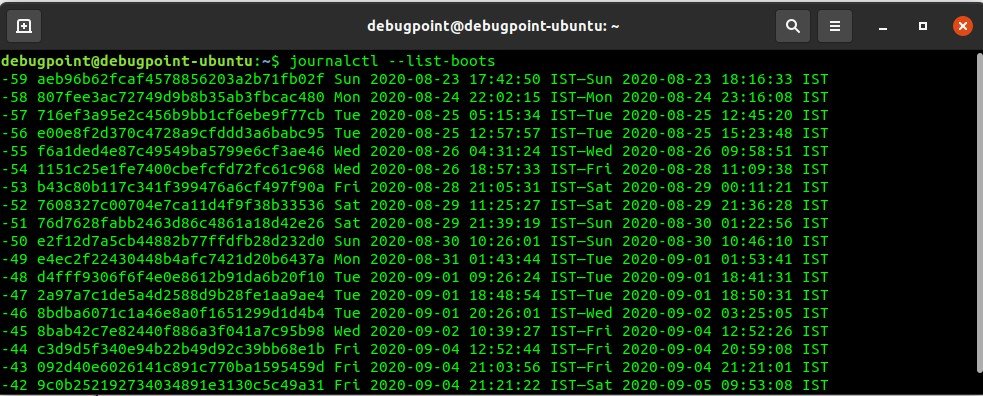
Journal logs keep on updating in every reboot. The journald keeps track of the logs in different boots. To view, the boot-wise logs use the below command.
journalctl --list-boots
- The first number shows the unique journald boot track number which you can use in the next command to analyze that specific boot.
- The second number the boot ID which also you can specify in the commands.
- The next two date, time combinations are the duration of the logs stored in the respective file. This is super handy if you want to find out a log or error from a specific date, time.
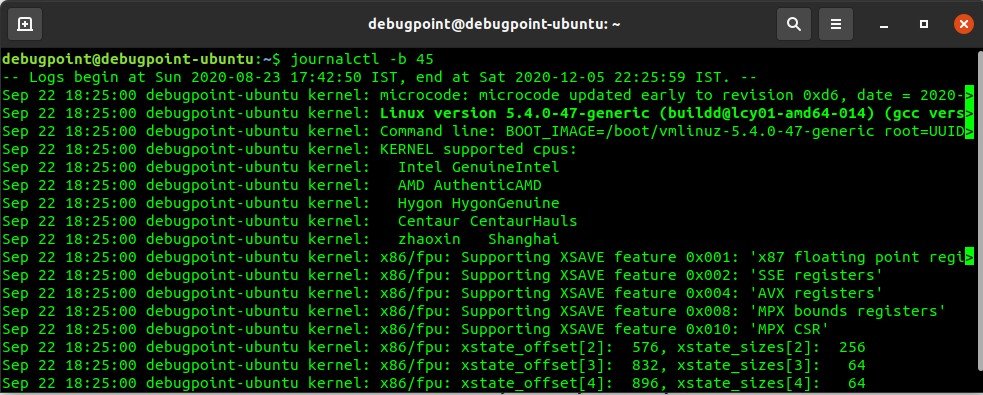
To view a specific boot number you the first number or the boot ID as below.
journalctl -b -45
journalctl -b 8bab42c7e82440f886a3f041a7c95b98
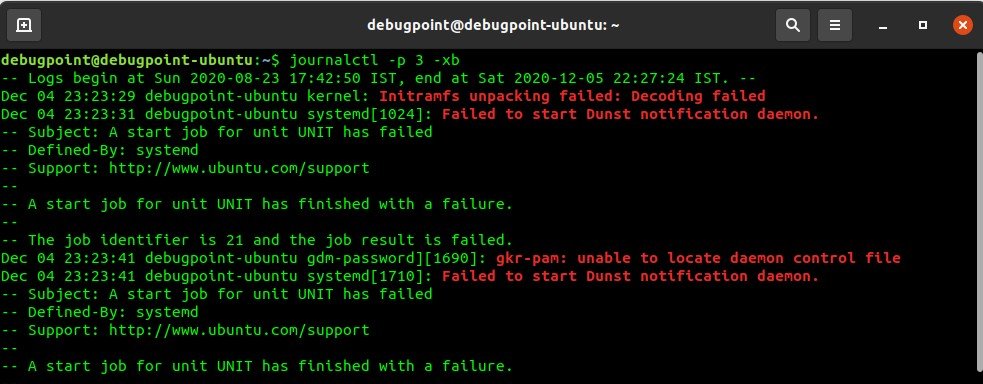
You can also use -x switch which can add an explanation of the systemd error messages in your display. This is a lifesaver in certain situations.
journalctl -xb -p 3
How to view journal logs for a specific time, date duration
The journalctl is powerful enough to provide “english” like argument in the command itself for time and date manipulation.
You can use--since switch with a combination of “yesterday”, “today”, “tomorrow”, or “now”.
Some of the examples of different commands below. You can modify them as per your need. They are self-explanatory. The date, time format in the below commands are "YYYY-MM-DD HH:MM:SS"
journalctl --since "2020-12-04 06:00:00"
journalctl --since "2020-12-03" --until "2020-12-05 03:00:00"
journalctl --since yesterday
journalctl --since 09:00 --until "1 hour ago"
You can combine the above with the error level switches as well.
How to see Kernel specific journal logs
The Linux Kernel messages can be extracted from journal logs as well. To view the Kernel messages from the current boot only use the below command.
journalctl -k
How to see journal logs for a service, PID
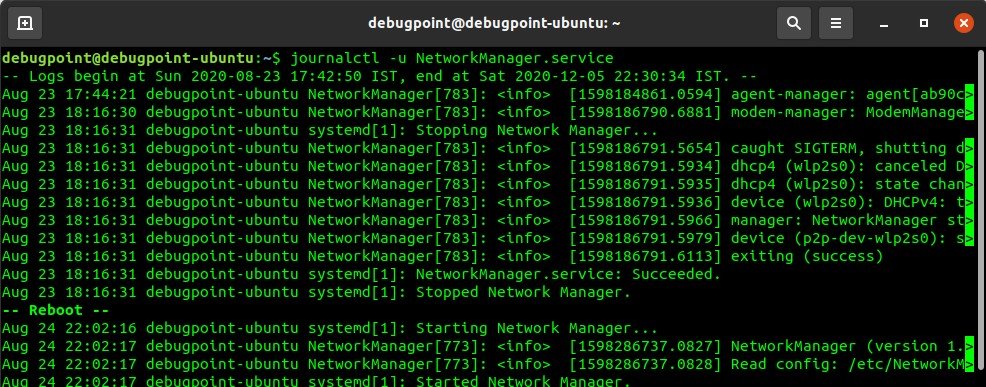
You can filter out specific logs from a systemd service unit only from the journald logs. For example, to find out the logs from NetworkManager service use the below command.
journalctl -u NetworkManager.service
If you do not know the service name, you can use the below command to list the systemd services in your system.
systemctl list-units --type=service
How to view journal logs for a user, group
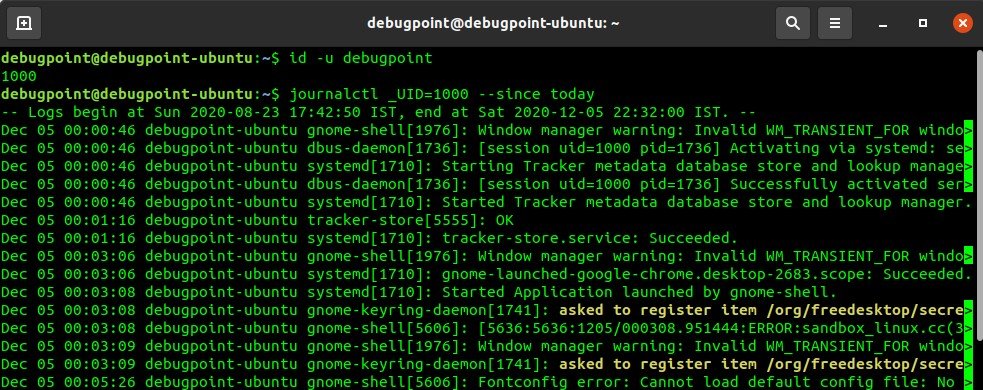
If you are analyzing server logs this command is helpful where multiple users are logged in. You can first find out about the user id using the below command from the user name. For example, to find out the id of user “debugpoint” –
id -u debugpoint
Then use that ID with _UID switch to view the logs generated by the user.
journalctl _UID=1000 --since today
Similarly use _GID switch to find out the same for user groups.
How to view journal logs for an executable
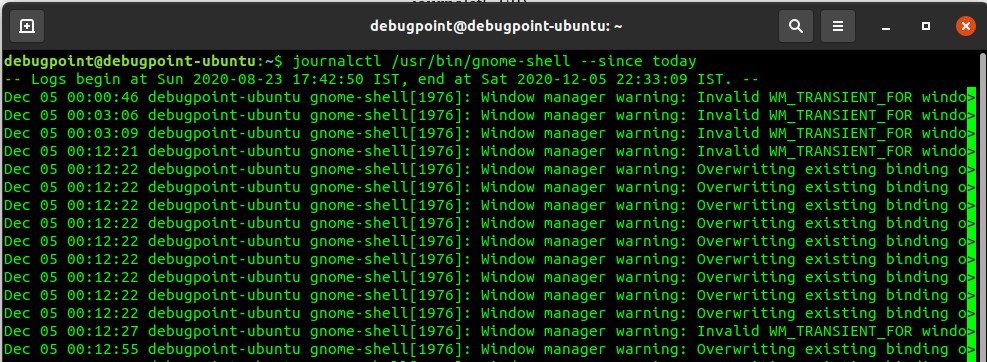
You can also find out journald logs of a specific program or executable. For example, if you want to find out the messages of gnome-shell, you can run the below command.
journalctl /usr/bin/gnome-shell --since today
Closing notes
I hope this guide helps you to use journalctl to view analyze systemd logs on your Linux desktop or server troubleshooting. The systemd journal management extremely powerful if you know how to use the commands, it makes your life a bit easy during debugging time. All major mainstream Linux distribution uses Systemd these days. Ubuntu, Debian, Fedora, Arch – they all use systemd for their default OS offerings. In case if you are wondering about systemd-free Linux distributions, you might want to check out MX-Linux, Gentoo, Slackware, Void Linux.
via: https://www.debugpoint.com/systemd-journalctl/
