6.5 KiB
Translating by ZTinoZ 7 command line tools for monitoring your Linux system
**Here is a selection of basic command line tools that will make your exploration and optimization in Linux easier. **
Dive on in
One of the great things about Linux is how deeply you can dive into the system to explore how it works and to look for opportunities to fine tune performance or diagnose problems. Here is a selection of basic command line tools that will make your exploration and optimization easier. Most of these commands are already built into your Linux system, but in case they aren’t, just Google “install”, the command name, and the name of your distro and you’ll find which package needs installing (note that some commands are bundled with other commands in a package that has a different name from the one you’re looking for). If you have any other tools you use, let me know for our next Linux Tools roundup.
How we did it
FYI: The screenshots in this collection were created on Debian Linux 8.1 (“Jessie”) running in a virtual machine under Oracle VirtualBox 4.3.28 under OS X 10.10.3 (“Yosemite”). See my next slideshow “How to install Debian Linux in a VirtualBox VM” for a tutorial on how to build your own Debian VM.
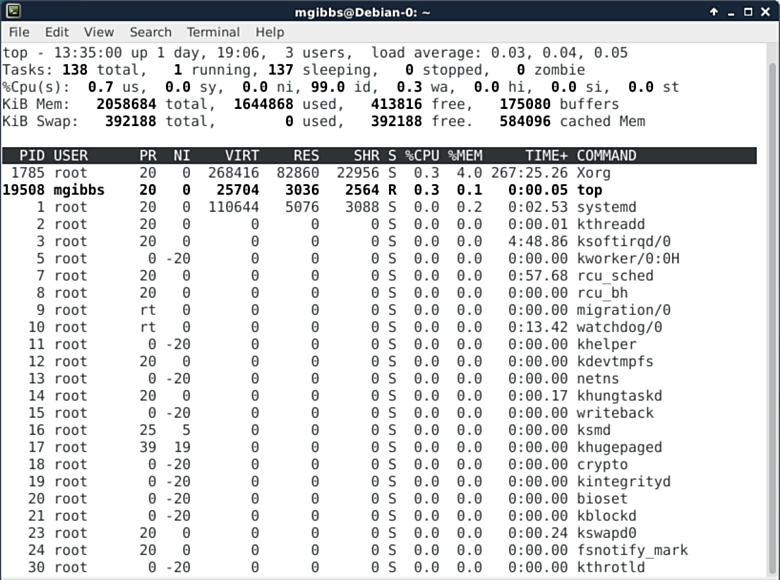
Top command
One of the simpler Linux system monitoring tools, the top command comes with pretty much every flavor of Linux. This is the default display, but pressing the “z” key switches the display to color. Other hot keys and command line switches control things such as the display of summary and memory information (the second through fourth lines), sorting the list according to various criteria, killing tasks, and so on (you can find the complete list at here).
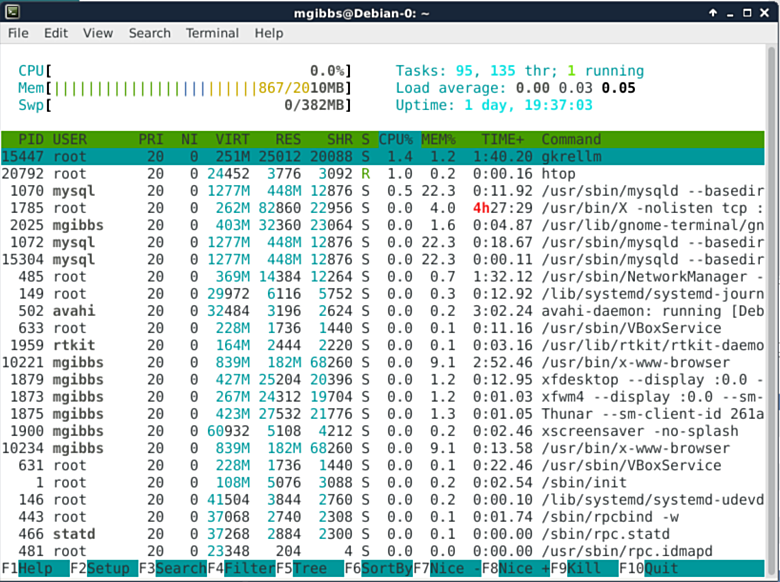
htop
Htop is a more sophisticated alternative to top. Wikipedia: “Users often deploy htop in cases where Unix top does not provide enough information about the systems processes, for example when trying to find minor memory leaks in applications. Htop is also popularly used interactively as a system monitor. Compared to top, it provides a more convenient, cursor-controlled interface for sending signals to processes.” (For more detail go here.)
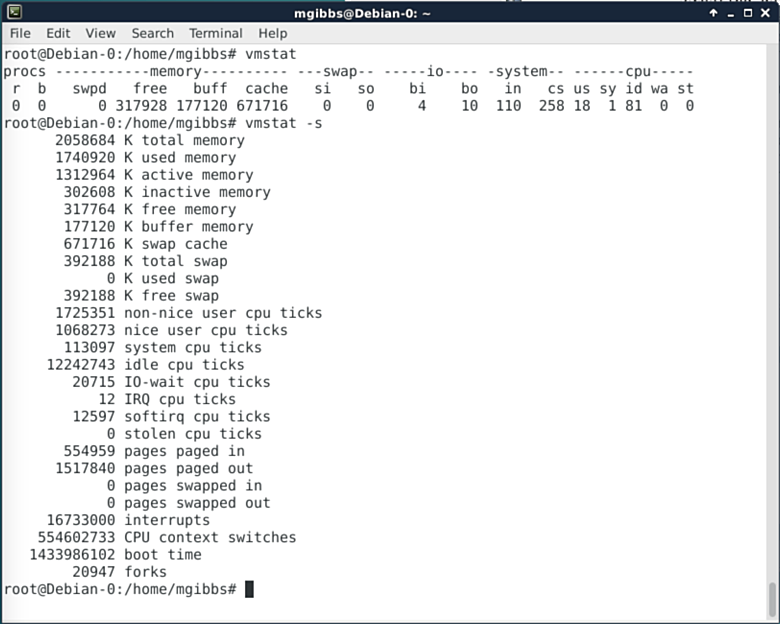
Vmstat
Vmstat is a simpler tool for monitoring your Linux system performance statistics but that makes it highly suitable for use in shell scripts. Fire up your regex-fu and you can do some amazing things with vmstat and cron jobs. “The first report produced gives averages since the last reboot. Additional reports give information on a sampling period of length delay. The process and memory reports are instantaneous in either case” (go here for more info.).
ps
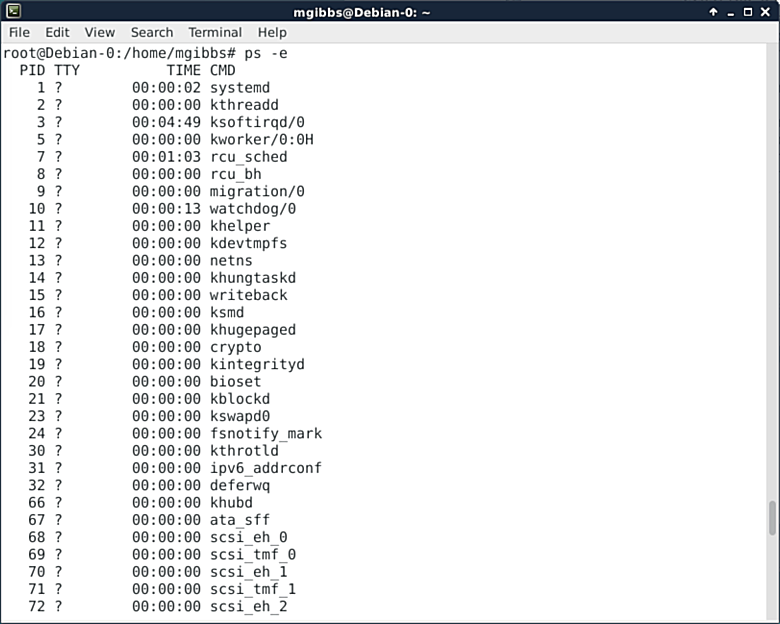
The ps command shows a list of running processes. In this case, I’ve used the “-e”switch to show everything, that is, all processes running (I’ve scrolled back to the top of the output otherwise the column names wouldn’t be visible). This command has a lot of switches that allow you to format the output as needed. Add a little of the aforementioned regex-fu and you’ve got a powerful tool. Go here for the full details.
Pstree
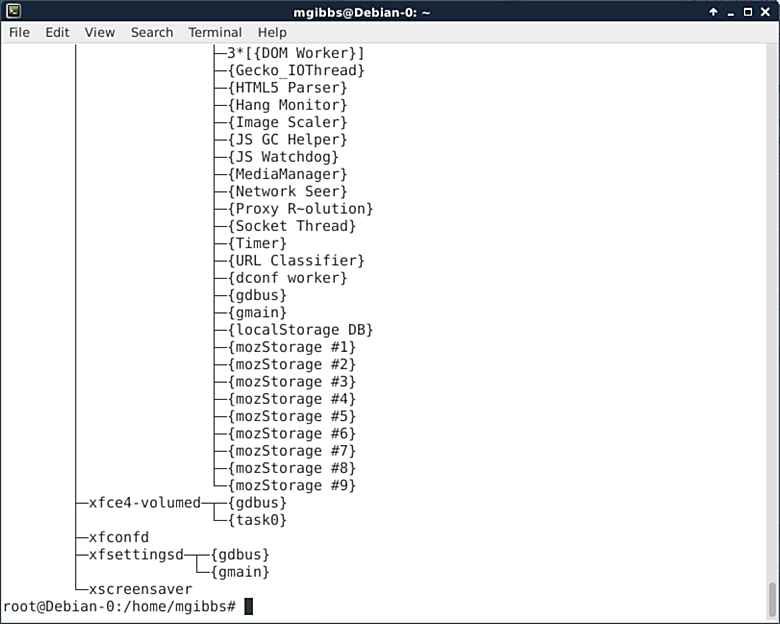
Pstree “shows running processes as a tree. The tree is rooted at either pid or init if pid is omitted. If a user name is specified, all process trees rooted at processes owned by that user are shown.”This is a really useful tool as the tree helps you sort out which process is dependent on which process (go here).
pmap
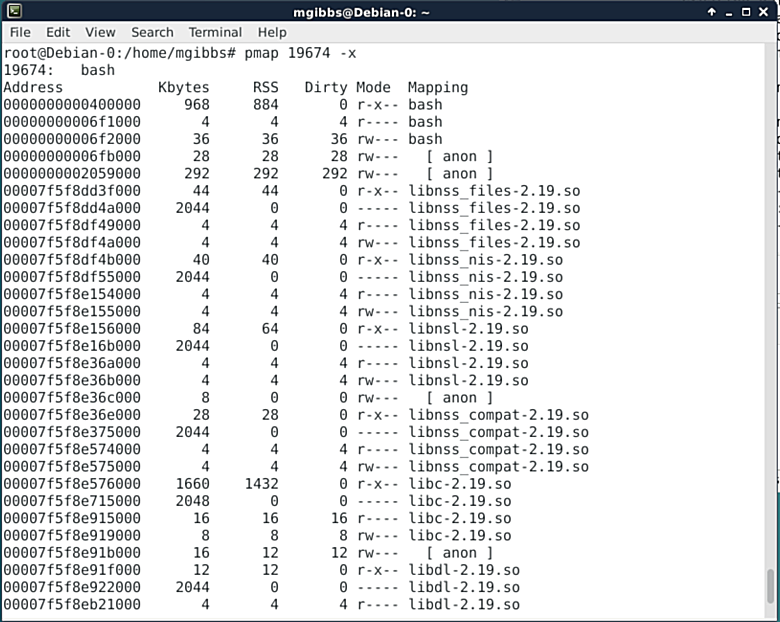
Understanding just how an app uses memory is often crucial in debugging, and the pmap produces just such information when given a process ID (PID). The screenshot shows the medium weight output generated by using the “-x”switch. You can get pmap to produce even more detailed information using the “-X”switch but you’ll need a much wider terminal window.
iostat
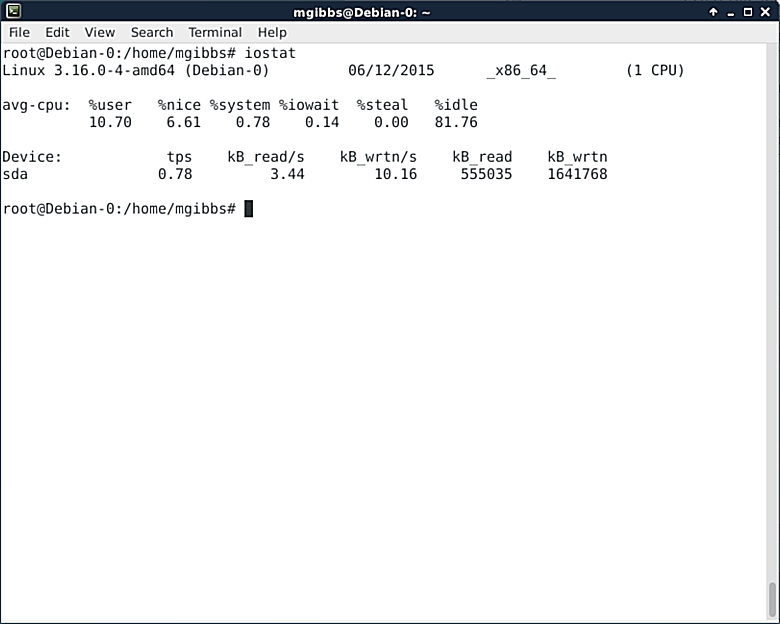
A crucial factor in your Linux system’s performance is processor and storage usage, which are what the iostat command reports on. As with the ps command, iostat has loads of switches that allow you to select the output format you need as well as sample performance over a time period and then repeat that sampling a number of times before reporting. See here.
作者:Mark Gibbs 译者:译者ID 校对:校对者ID

