7.4 KiB
Notes on BPF & eBPF
Today it was Papers We Love, my favorite meetup! Today Suchakra Sharma(@tuxology on twitter/github) gave a GREAT talk about the original BPF paper and recent work in Linux on eBPF. It really made me want to go write eBPF programs!
The paper is The BSD Packet Filter: A New Architecture for User-level Packet Capture
I wanted to write some notes on the talk here because I thought it was super super good.
To start, here are the slides and a pdf. The pdf is good because there are links at the end and in the PDF you can click the links.
what’s BPF?
Before BPF, if you wanted to do packet filtering you had to copy all the packets into userspace and then filter them there (with “tap”).
this had 2 problems:
-
if you filter in userspace, it means you have to copy all the packets into userspace, copying data is expensive
-
the filtering algorithms people were using were inefficient
The solution to problem #1 seems sort of obvious, move the filtering logic into the kernel somehow. Okay. (though the details of how that’s done isn’t obvious, we’ll talk about that in a second)
But why were the filtering algorithms inefficient! Well!!
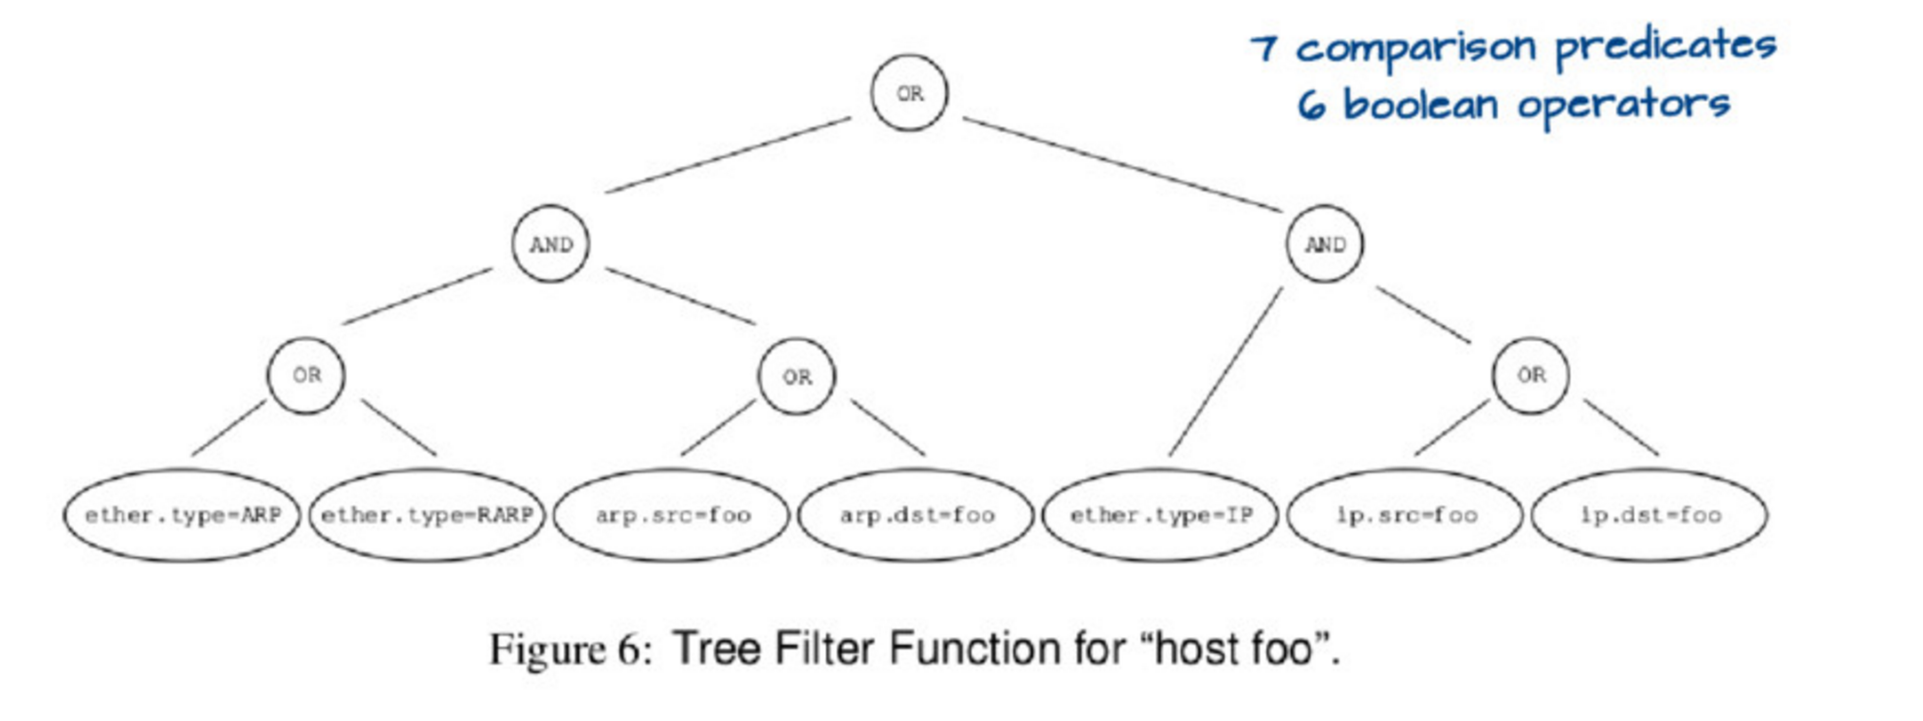
If you run tcpdump host foo it actually runs a relatively complicated query, which you could represent with this tree:
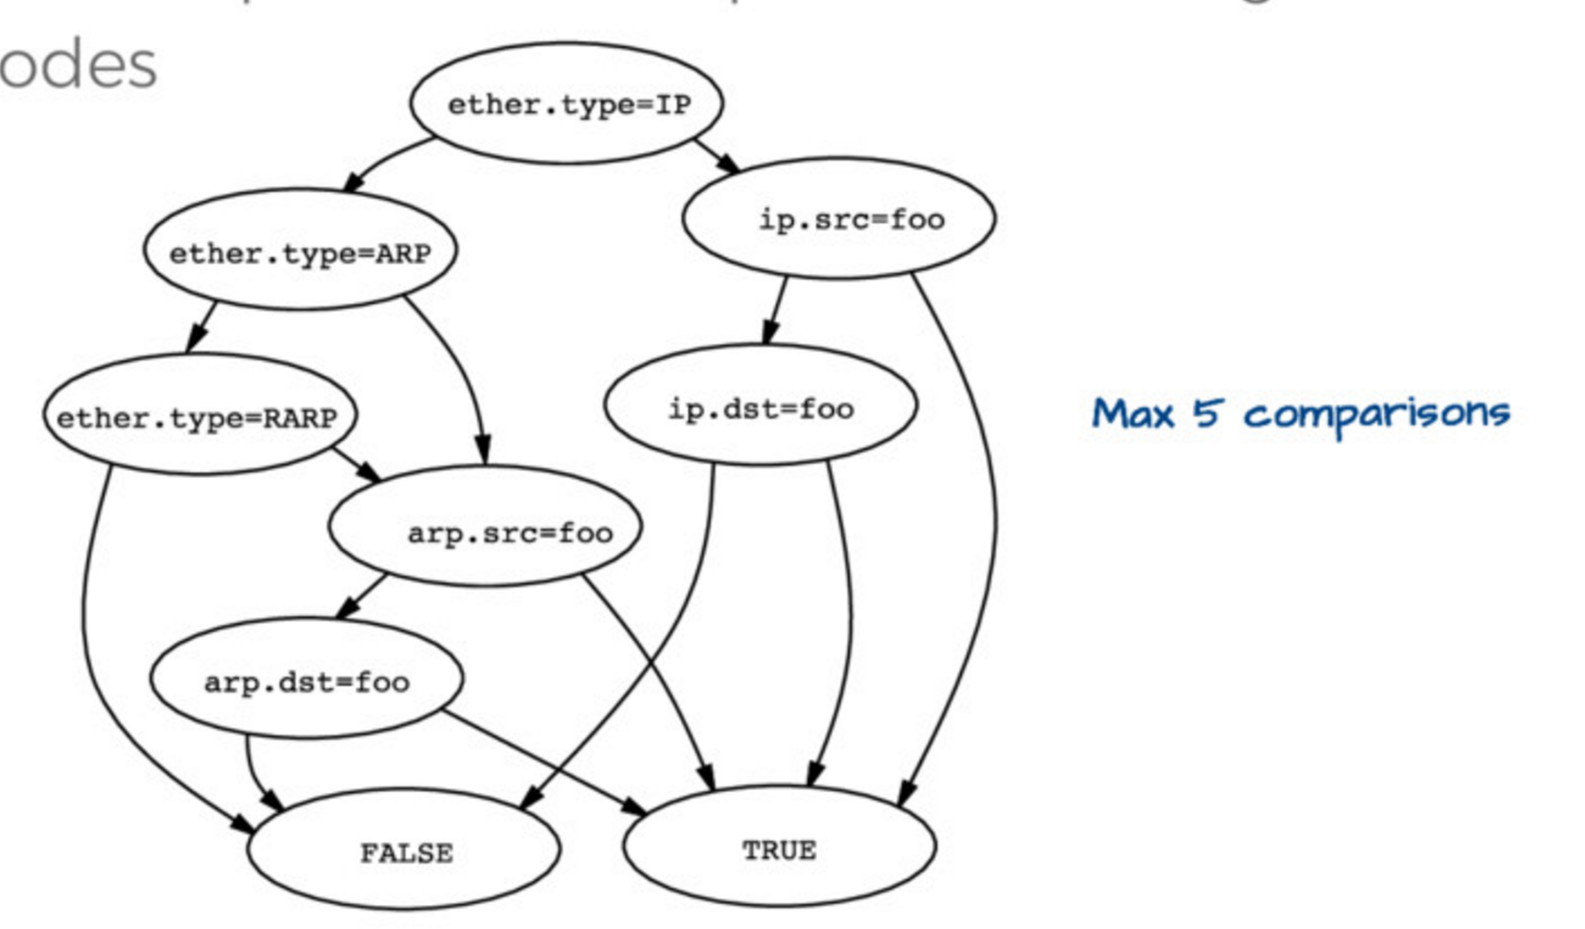
Evaluating this tree is kind of expensive. so the first insight is that you can actually represent this tree in a simpler way, like this:
Then if you have ether.type = IP and ip.src = foo you automatically know that the packet matches host foo, you don’t need to check anything else. So this data structure (they call it a “control flow graph” or “CFG”) is a way better representation of the program you actually want to execute to check matches than the tree we started with.
How BPF works in the kernel
The main important here is that packets are just arrays of bytes. BPF programs run on these arrays of bytes. They’re not allowed to have loops but they can have smart stuff to figure out the length of the IP header (IPv6 & IPv4 are different lengths!) and then find the TCP port based on that length
x = ip_header_length
port = *(packet_start + x + port_offset)
(it looks different from that but it’s basically the same). There’s a nice description of the virtual machine in the paper/slides so I won’t explain it.
When you run tcpdump host foo this is what happens, as far as I understand
-
convert
host foointo an efficient DAG of the rules -
convert that DAG into a BPF program (in BPF bytecode) for the BPF virtual machine
-
Send the BPF bytecode to the Linux kernel, which verifies it
-
compile the BPF bytecode program into native code. For example here’s the JIT code for ARM and for x86
-
when packets come in, Linux runs the native code to decide if that packet should be filtered or not. It’l often run only 100-200 CPU instructions for each packet that needs to be processed, which is super fast!
the present: eBPF
But BPF has been around for a long time! Now we live in the EXCITING FUTURE which is eBPF. I’d heard about eBPF a bunch before but I felt like this helped me put the pieces together a little better. (i wrote this XDP & eBPF postback in April when I was at netdev)
some facts about eBPF:
-
eBPF programs have their own bytecode language, and are compiled from that bytecode language into native code in the kernel, just like BPF programs
-
eBPF programs run in the kernel
-
eBPF programs can’t access arbitrary kernel memory. Instead the kernel provides functions to get at some restricted subset of things.
-
they can communicate with userspace programs through BPF maps
-
there’s a
bpfsyscall as of Linux 3.18
kprobes & eBPF
You can pick a function (any function!) in the Linux kernel and execute a program that you write every time that function happens. This seems really amazing and magical.
For example! There’s this BPF program called disksnoop which tracks when you start/finish writing a block to disk. Here’s a snippet from the code:
BPF_HASH(start, struct request *);
void trace_start(struct pt_regs *ctx, struct request *req) {
	// stash start timestamp by request ptr
	u64 ts = bpf_ktime_get_ns();
	start.update(&req, &ts);
}
...
b.attach_kprobe(event="blk_start_request", fn_name="trace_start")
b.attach_kprobe(event="blk_mq_start_request", fn_name="trace_start")
This basically declares a BPF hash (which the program uses to keep track of when the request starts / finishes), a function called trace_start which is going to be compiled into BPF bytecode, and attaches trace_start to the blk_start_request kernel function.
This is all using the bcc framework which lets you write Python-ish programs that generate BPF code. You can find it (it has tons of example programs) athttps://github.com/iovisor/bcc
uprobes & eBPF
So I sort of knew you could attach eBPF programs to kernel functions, but I didn’t realize you could attach eBPF programs to userspace functions! That’s really exciting. Here’s an example of counting malloc calls in Python using an eBPF program.
things you can attach eBPF programs to
-
network cards, with XDP (which I wrote about a while back)
-
tc egress/ingress (in the network stack)
-
kprobes (any kernel function)
-
uprobes (any userspace function apparently ?? like in any C program with symbols.)
-
probes that were built for dtrace called “USDT probes” (like these mysql probes). Here’s an example program using dtrace probes
-
tracepoints (not sure what that is yet)
-
seccomp / landlock security things
-
a bunch more things
this talk was super cool
There are a bunch of great links in the slides and in LINKS.md in the iovisor repository. It is late now but soon I want to actually write my first eBPF program!
via: https://jvns.ca/blog/2017/06/28/notes-on-bpf---ebpf/
作者:Julia Evans 译者:译者ID 校对:校对者ID

