7.7 KiB
Top 5 open source community metrics to track
So you decided to use metrics to track your free, open source software (FOSS) community. Now comes the big question: Which metrics should I be tracking?
To answer this question, you must have an idea of what information you need. For example, you may want to know about the sustainability of the project community. How quickly does the community react to problems? How is the community attracting, retaining, or losing contributors? Once you decide which information you need, you can figure out which traces of community activity are available to provide it. Fortunately, FOSS projects following an open development model tend to leave loads of public data in their software development repositories, which can be analyzed to gather useful data.
In this article, I'll introduce metrics that help provide a multi-faceted view of your project community.
1. Activity
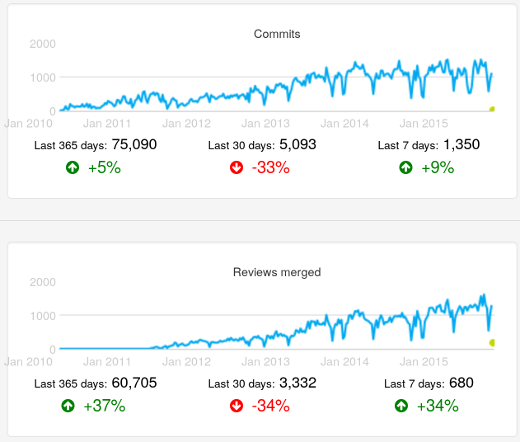
The overall activity of the community and how it evolves over time is a useful metric for all open source communities. Activity provides a first view of how much the community is doing, and can be used to track different kinds of activity. For example, the number of commits gives a first idea about the volume of the development effort. The number of tickets opened provides insight into how many bugs are reported or new features are proposed. The number of messages in mailing lists or posts in forums gives an idea of how much discussion is being held in public.
Number of commits and number of merged changes after code review in the OpenStack project, as found in the OpenStack Activity Dashboard. Evolution over time (weekly data).
2. Size
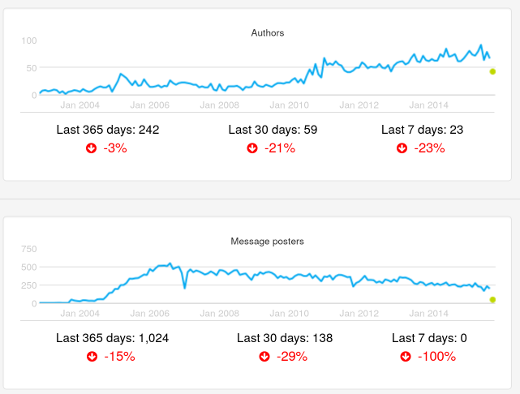
The size of the community is the number of people participating in it, but, depending on the kind of participation, size numbers may vary. Usually you're interested in active contributors, which is good news. Active people may leave traces in the repositories of the project, which means you can count contributors who are active in producing code by looking at the Author field in git repositories, or count people participating in the resolution of tickets by looking at who is contributing to them.
This basic idea of activity" (somebody did something) can be extended in many ways. One common way to track activity is to look at how many people did a sizable chunk of the activity. Generally most of a project's code contributions, for example, are from a small fraction of the people in the project's community. Knowing about that fraction helps provide an idea of the core group (i.e., the people who help lead the community).
Number of authors and number of posters in mailing lists in the Xen project, as found in the Xen Project Development Dashboard. Evolution over time (monthly data).
3. Performance
So far, I have focused on measuring quantities of activities and contributors. You also can analyze how processes and people are performing. For example, you can measure how long processes take to finish. Time to resolve or close tickets shows how the project is reacting to new information that requires action, such as fixing a reported bug or implementing a requested new feature. Time spent in code review—from the moment when a change to the code is proposed to the moment it is accepted—shows how long upgrading a proposed change to the quality standards expected by the community takes.
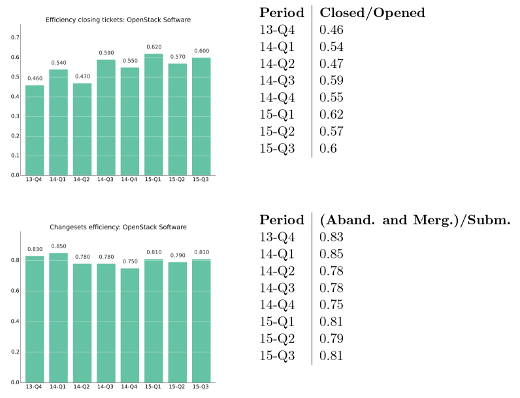
Other metrics deal with how well the project is coping with pending work, such as the ratio of new to closed tickets, or the backlog of still non-completed code reviews. Those parameters tell us, for example, whether or not the resources put into solving issues is enough.
Ratio of tickets closed by tickets opened, and ratio of change proposals accepted or abandoned by new change proposals per quarter. OpenStack project, as shown in the OpenStack Development Report, 2015-Q3 (PDF).
4. Demographics
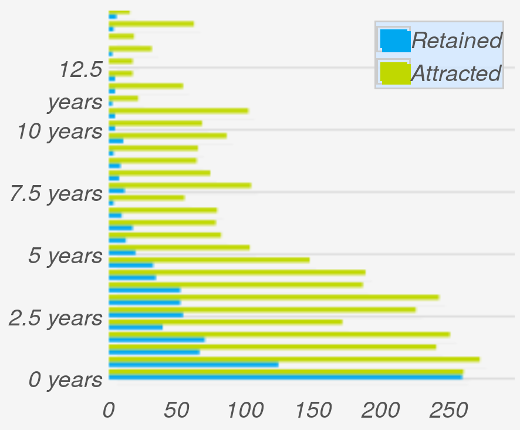
Communities change as contributors move in and out. Depending on how people enter and leave a community over time, the age (time since members joined the community) of the community varies. The community aging chart nicely illustrates these exchanges over time. The chart is structured as a set of horizontal bars, two per "generation" of people joining the community. For each generation, the attracted bar shows how many new people joined the community during the corresponding period of time. The retained bar shows how many people are still active in the community.
The relationship between the two bars for each generation is the retention rate: the fraction of people of that generation who are still in the project. The complete set of attracted bars show how attractive the project was in the past. And the complete set of the retention bars shows the current age structure of the community.
Community aging chart for the Eclipse community, as shown in the Eclipse Development Dashboard. Generations are defined every six months.
5. Diversity
Diversity is an important factor in the resiliency of communities. In general, the more diverse communities are—in terms of people or organizations participating—the more resilient they are. For example, when a company decides to leave a FOSS community, the potential problems the departure may cause are much smaller if its employees were contributing 5% of the work rather than 85%.
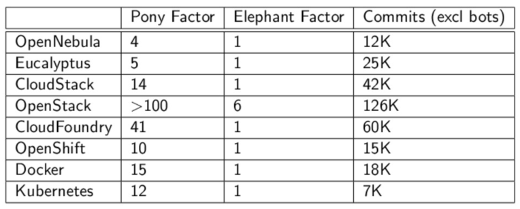
The Pony Factor, a term defined by Daniel Gruno for the minimum number of developers performing 50% of the commits. Based on the Pony Factor, the Elephant Factor is the minimum number of companies whose employees perform 50% of the commits. Both numbers provide an indication of how many people or companies the community depends on.
Pony and Elephant Factor for several FOSS projects in the area of cloud computing, as presented in The quantitative state of the open cloud 2015 (slides).
There are many other metrics to help measure a community. When determing which metrics to collect, think about the goals of your community, and which metrics will help you reach them.
via: https://opensource.com/business/15/12/top-5-open-source-community-metrics-track
作者:Jesus M. Gonzalez-Barahona 译者:译者ID 校对:校对者ID

