11 KiB
Building a non-breaking breakpoint for Python debugging
Have you ever wondered how to speed up a debugger? Here are some lessons
learned while building one for Python.

This is the story of how our team at Rookout built non-breaking breakpoints for Python and some of the lessons we learned along the way. I'll be presenting all about the nuts and bolts of debugging in Python at PyBay 2019 in San Francisco this month. Let's dig in.
The heart of Python debugging: sys.set_trace
There are many Python debuggers out there. Some of the more popular include:
- pdb, part of the Python standard library
- PyDev, the debugger behind the Eclipse and PyCharm IDEs
- ipdb, the IPython debugger
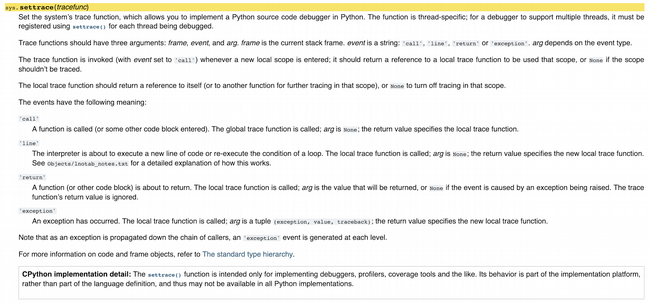
Despite the range of choices, almost every Python debugger is based on just one function: sys.set_trace. And let me tell you, sys.settrace might just be the most complex function in the Python standard library.
In simpler terms, settrace registers a trace function for the interpreter, which may be called in any of the following cases:
- Function call
- Line execution
- Function return
- Exception raised
A simple trace function might look like this:
def simple_tracer(frame, event, arg):
  co = frame.f_code
  func_name = co.co_name
  line_no = frame.f_lineno
  print("{e} {f} {l}".format(
e=event, f=func_name, l=line_no))
  return simple_tracer
When looking at this function, the first things that come to mind are its arguments and return values. The trace function arguments are:
- frame object, which is the full state of the interpreter at the point of the function's execution
- event string, which can be call, line, return, or exception
- arg object, which is optional and depends on the event type
The trace function returns itself because the interpreter keeps track of two kinds of trace functions:
- Global trace function (per thread): This trace function is set for the current thread by sys.settrace and is invoked whenever a new frame is created by the interpreter (essentially on every function call). While there's no documented way to set the trace function for a different thread, you can call threading.settrace to set the trace function for all newly created threading module threads.
- Local trace function (per frame): This trace function is set by the interpreter to the value returned by the global trace function upon frame creation. There's no documented way to set the local trace function once the frame has been created.
This mechanism is designed to allow the debugger to have more granular control over which frames are traced to reduce performance impact.
Building our debugger in three easy steps (or so we thought)
With all that background, writing your own debugger using a custom trace function looks like a daunting task. Luckily, pdb, the standard Python debugger, is built on top of Bdb, a base class for building debuggers.
A naive breakpoints debugger based on Bdb might look like this:
import bdb
import inspect

class Debugger(bdb.Bdb):
  def __init__(self):
      Bdb.__init__(self)
      self.breakpoints = dict()
      self.set_trace()

def set_breakpoint(self, filename, lineno, method):
  self.set_break(filename, lineno)
  try :
      self.breakpoints[(filename, lineno)].add(method)
  except KeyError:
      self.breakpoints[(filename, lineno)] = [method]

def user_line(self, frame):
  if not self.break_here(frame):
      return

  # Get filename and lineno from frame
  (filename, lineno, _, _, _) = inspect.getframeinfo(frame)

  methods = self.breakpoints[(filename, lineno)]
  for method in methods:
      method(frame)
All this does is:
- Inherits from Bdb and write a simple constructor initializing the base class and tracing.
- Adds a set_breakpoint method that uses Bdb to set the breakpoint and keeps track of our breakpoints.
- Overrides the user_line method that is called by Bdb on certain user lines. The function makes sure it is being called for a breakpoint, gets the source location, and invokes the registered breakpoints
How well did the simple Bdb debugger work?
Rookout is about bringing a debugger-like user experience to production-grade performance and use cases. So, how well did our naive breakpoint debugger perform?
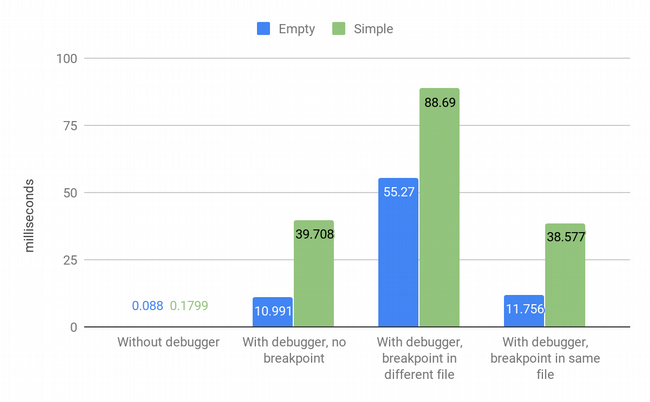
To test it and measure the global performance overhead, we wrote two simple test methods and executed each of them 16 million times under multiple scenarios. Keep in mind that no breakpoint was executed in any of the cases.
def empty_method():
   pass

def simple_method():
   a = 1
   b = 2
   c = 3
   d = 4
   e = 5
   f = 6
   g = 7
   h = 8
   i = 9
   j = 10
Using the debugger takes a shocking amount of time to complete. The bad results make it clear that our naive Bdb debugger is not yet production-ready.
Optimizing the debugger
There are three main ways to reduce debugger overhead:
- Limit local tracing as much as possible: Local tracing is very costly compared to global tracing due to the much larger number of events per line of code.
- Optimize "call" events and return control to the interpreter faster: The main work in call events is deciding whether or not to trace.
- Optimize "line" events and return control to the interpreter faster: The main work in line events is deciding whether or not we hit a breakpoint.
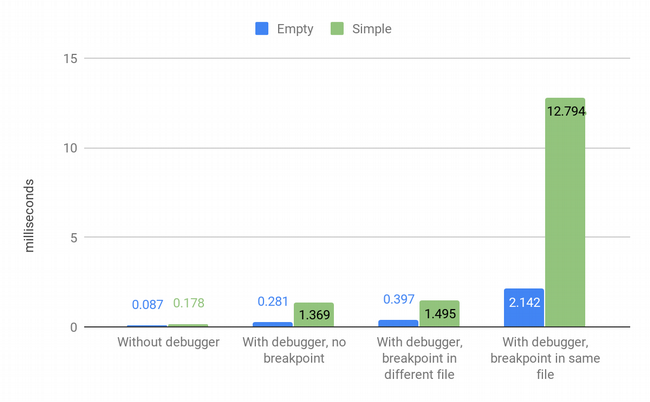
So we forked Bdb, reduced the feature set, simplified the code, optimized for hot code paths, and got impressive results. However, we were still not satisfied. So, we took another stab at it, migrated and optimized our code to .pyx, and compiled it using Cython. The final results (as you can see below) were still not good enough. So, we ended up diving into CPython's source code and realizing we could not make tracing fast enough for production use.
Rejecting Bdb in favor of bytecode manipulation
After our initial disappointment from the trial-and-error cycles of standard debugging methods, we decided to look into a less obvious option: bytecode manipulation.
The Python interpreter works in two main stages:
- Compiling Python source code into Python bytecode: This unreadable (for humans) format is optimized for efficient execution and is often cached in those .pyc files we have all come to love.
- Iterating through the bytecode in the interpreter loop: This executes one instruction at a time.
This is the pattern we chose: use bytecode manipulation to set non-breaking breakpoints with no global overhead. This is done by finding the bytecode in memory that represents the source line we are interested in and inserting a function call just before the relevant instruction. This way, the interpreter does not have to do any extra work to support our breakpoints.
This approach is not magic. Here's a quick example.
We start with a very simple function:
def multiply(a, b):
   result = a * b
   return result
In documentation hidden in the inspect module (which has several useful utilities), we learn we can get the function's bytecode by accessing multiply.func_code.co_code:
`'|\x00\x00|\x01\x00\x14}\x02\x00|\x02\x00S'`
This unreadable string can be improved using the dis module in the Python standard library. By calling dis.dis(multiply.func_code.co_code), we get:
  4          0 LOAD_FAST               0 (a)
             3 LOAD_FAST               1 (b)
             6 BINARY_MULTIPLY
             7 STORE_FAST              2 (result)

  5         10 LOAD_FAST               2 (result)
            13 RETURN_VALUE
This gets us closer to understanding what happens behind the scenes of debugging but not to a straightforward solution. Unfortunately, Python does not offer a method for changing a function's bytecode from within the interpreter. You can overwrite the function object, but that's not good enough for the majority of real-world debugging scenarios. You have to go about it in a roundabout way using a native extension.
Conclusion
When building a new tool, you invariably end up learning a lot about how stuff works. It also makes you think out of the box and keep your mind open to unexpected solutions.
Working on non-breaking breakpoints for Rookout has taught me a lot about compilers, debuggers, server frameworks, concurrency models, and much much more. If you are interested in learning more about bytecode manipulation, Google's open source cloud-debug-python has tools for editing bytecode.
Liran Haimovitch will present "Understanding Python’s Debugging Internals" at PyBay, which will be held August 17-18 in San Francisco. Use code OpenSource35 for a discount when you purchase your ticket to let them know you found out about the event from our community.
via: https://opensource.com/article/19/8/debug-python
作者:Liran Haimovitch 选题:lujun9972 译者:译者ID 校对:校对者ID


