mirror of
https://github.com/LCTT/TranslateProject.git
synced 2025-01-10 22:21:11 +08:00
126 lines
9.9 KiB
Markdown
126 lines
9.9 KiB
Markdown
[#]: collector: (lujun9972)
|
|
[#]: translator: ( )
|
|
[#]: reviewer: ( )
|
|
[#]: publisher: ( )
|
|
[#]: url: ( )
|
|
[#]: subject: (Top 5 open source network monitoring tools)
|
|
[#]: via: (https://opensource.com/article/19/2/network-monitoring-tools)
|
|
[#]: author: (Paul Bischoff https://opensource.com/users/paulbischoff)
|
|
|
|
Top 5 open source network monitoring tools
|
|
======
|
|
Keep an eye on your network to avoid downtime with these monitoring tools.
|
|

|
|
|
|
Maintaining a live network is one of a system administrator's most essential tasks, and keeping a watchful eye over connected systems is essential to keeping a network functioning at its best.
|
|
|
|
There are many different ways to keep tabs on a modern network. Network monitoring tools are designed for the specific purpose of monitoring network traffic and response times, while application performance management solutions use agents to pull performance data from the application stack. If you have a live network, you need network monitoring to make sure you aren't vulnerable to an attacker. Likewise, if you rely on lots of different applications to run your daily operations, you will need an [application performance management][1] solution as well.
|
|
|
|
This article will focus on open source network monitoring tools. These tools help monitor individual nodes and applications for signs of poor performance. Through one window, you can view the performance of an entire network and even get alerts to keep you in the loop if you're away from your desk.
|
|
|
|
Before we get into the top five network monitoring tools, let's look more closely at the reasons you need to use one.
|
|
|
|
### Why do I need a network monitoring tool?
|
|
|
|
Network monitoring tools are vital to maintaining networks because they allow you to keep an eye on devices connected to the network from a central location. These tools help flag devices with subpar performance so you can step in and run troubleshooting to get to the root of the problem.
|
|
|
|
Running in-depth troubleshooting can minimize performance problems and prevent security breaches. In practical terms, this keeps the network online and eliminates the risk of falling victim to unnecessary downtime. Regular network maintenance can also help prevent outages that could take thousands of users offline.
|
|
|
|
A network monitoring tool enables you to:
|
|
|
|
* Autodiscover devices connected to your network
|
|
* View live and historic performance data for a range of devices and applications
|
|
* Configure alerts to notify you of unusual activity
|
|
* Generate graphs and reports to analyze network activity in greater depth
|
|
|
|
### The top 5 open source network monitoring tools
|
|
|
|
Now, that you know why you need a network monitoring tool, take a look at the top 5 open source tools to see which might best meet your needs.
|
|
|
|
#### Cacti
|
|
|
|
|
|
|
|
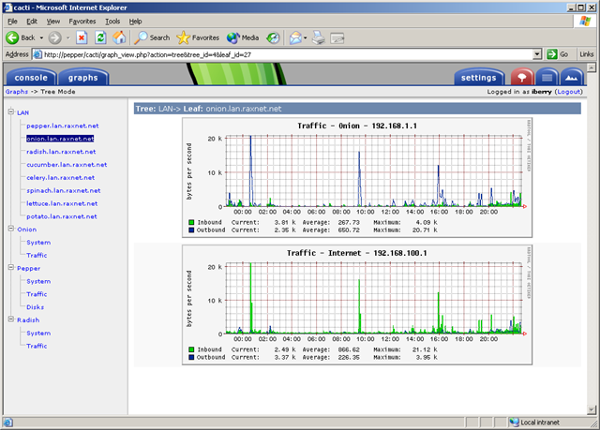
If you know anything about open source network monitoring tools, you've probably heard of [Cacti][2]. It's a graphing solution that acts as an addition to [RRDTool][3] and is used by many network administrators to collect performance data in LANs. Cacti comes with Simple Network Management Protocol (SNMP) support on Windows and Linux to create graphs of traffic data.
|
|
|
|
Cacti typically works by using data sourced from user-created scripts that ping hosts on a network. The values returned by the scripts are stored in a MySQL database, and this data is used to generate graphs.
|
|
|
|
This sounds complicated, but Cacti has templates to help speed the process along. You can also create a graph or data source template that can be used for future monitoring activity. If you'd like to try it out, [download Cacti][4] for free on Linux and Windows.
|
|
|
|
#### Nagios Core
|
|
|
|
|
|
|
|
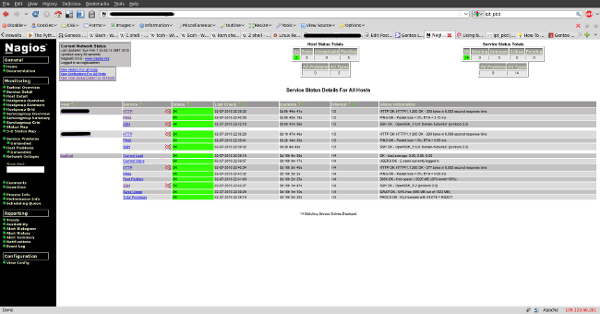
[Nagios Core][5] is one of the most well-known open source monitoring tools. It provides a network monitoring experience that combines open source extensibility with a top-of-the-line user interface. With Nagios Core, you can auto-discover devices, monitor connected systems, and generate sophisticated performance graphs.
|
|
|
|
Support for customization is one of the main reasons Nagios Core has become so popular. For example, [Nagios V-Shell][6] was added as a PHP web interface built in AngularJS, searchable tables and a RESTful API designed with CodeIgniter.
|
|
|
|
If you need more versatility, you can check the Nagios Exchange, which features a range of add-ons that can incorporate additional features into your network monitoring. These range from the strictly cosmetic to monitoring enhancements like [nagiosgraph][7]. You can try it out by [downloading Nagios Core][8] for free.
|
|
|
|
#### Icinga 2
|
|
|
|
|
|
|
|
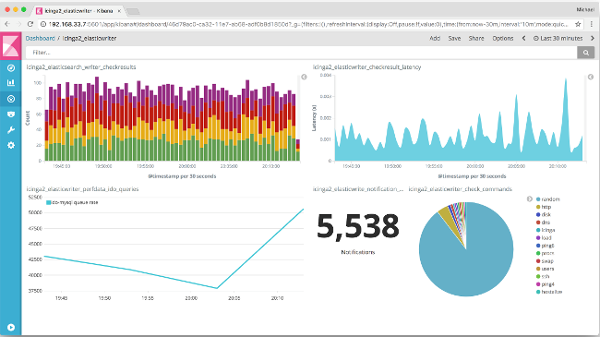
[Icinga 2][9] is another widely used open source network monitoring tool. It builds on the groundwork laid by Nagios Core. It has a flexible RESTful API that allows you to enter your own configurations and view live performance data through the dashboard. Dashboards are customizable, so you can choose exactly what information you want to monitor in your network.
|
|
|
|
Visualization is an area where Icinga 2 performs particularly well. It has native support for Graphite and InfluxDB, which can turn performance data into full-featured graphs for deeper performance analysis.
|
|
|
|
Icinga2 also allows you to monitor both live and historical performance data. It offers excellent alerts capabilities for live monitoring, and you can configure it to send notifications of performance problems by email or text. You can [download Icinga 2][10] for free for Windows, Debian, DHEL, SLES, Ubuntu, Fedora, and OpenSUSE.
|
|
|
|
#### Zabbix
|
|
|
|
|
|
|
|
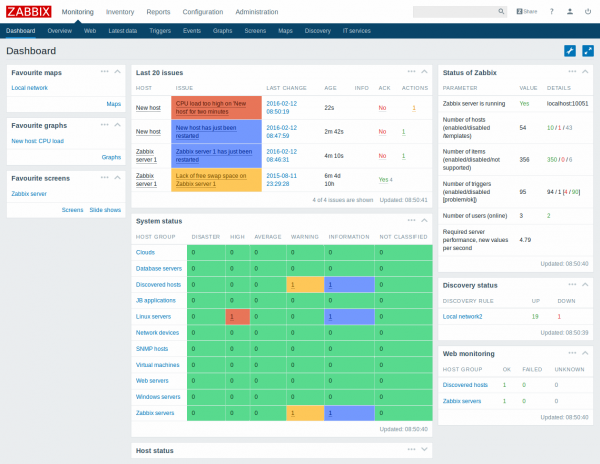
[Zabbix][11] is another industry-leading open source network monitoring tool, used by companies from Dell to Salesforce on account of its malleable network monitoring experience. Zabbix does network, server, cloud, application, and services monitoring very well.
|
|
|
|
You can track network information such as network bandwidth usage, network health, and configuration changes, and weed out problems that need to be addressed. Performance data in Zabbix is connected through SNMP, Intelligent Platform Management Interface (IPMI), and IPv6.
|
|
|
|
Zabbix offers a high level of convenience compared to other open source monitoring tools. For instance, you can automatically detect devices connected to your network before using an out-of-the-box template to begin monitoring your network. You can [download Zabbix][12] for free for CentOS, Debian, Oracle Linux, Red Hat Enterprise Linux, Ubuntu, and Raspbian.
|
|
|
|
#### Prometheus
|
|
|
|
|
|
|
|
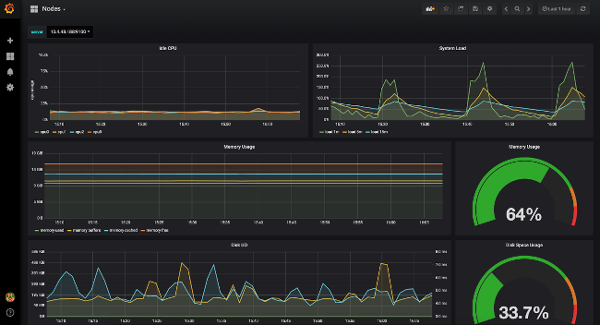
[Prometheus][13] is an open source network monitoring tool with a large community following. It was built specifically for monitoring time-series data. You can identify time-series data by metric name or key-value pairs. Time-series data is stored on local disks so that it's easy to access in an emergency.
|
|
|
|
Prometheus' [Alertmanager][14] allows you to view notifications every time it raises an event. Alertmanager can send notifications via email, PagerDuty, or OpsGenie, and you can silence alerts if necessary.
|
|
|
|
Prometheus' visual elements are excellent and allow you to switch from the browser to the template language and Grafana integration. You can also integrate various third-party data sources into Prometheus from Docker, StatsD, and JMX to customize your Prometheus experience.
|
|
|
|
As a network monitoring tool, Prometheus is suitable for organizations of all sizes. The onboard integrations and the easy-to-use Alertmanager make it capable of handling any workload, regardless of its size. You can [download Prometheus][15] for free.
|
|
|
|
### Which are best?
|
|
|
|
No matter what industry you're working in, if you rely on a network to do business, you need to implement some form of network monitoring. Network monitoring tools are an invaluable resource that help provide you with the visibility to keep your systems online. Monitoring your systems will give you the best chance to keep your equipment in working order.
|
|
|
|
As the tools on this list show, you don't need to spend an exorbitant amount of money to reap the rewards of network monitoring. Of the five, I believe Icinga 2 and Zabbix are the best options for providing you with everything you need to start monitoring your network to keep it online. Staying vigilant will help to minimize the change of being caught off-guard by performance issues.
|
|
|
|
--------------------------------------------------------------------------------
|
|
|
|
via: https://opensource.com/article/19/2/network-monitoring-tools
|
|
|
|
作者:[Paul Bischoff][a]
|
|
选题:[lujun9972][b]
|
|
译者:[译者ID](https://github.com/译者ID)
|
|
校对:[校对者ID](https://github.com/校对者ID)
|
|
|
|
本文由 [LCTT](https://github.com/LCTT/TranslateProject) 原创编译,[Linux中国](https://linux.cn/) 荣誉推出
|
|
|
|
[a]: https://opensource.com/users/paulbischoff
|
|
[b]: https://github.com/lujun9972
|
|
[1]: https://www.comparitech.com/net-admin/application-performance-management/
|
|
[2]: https://www.cacti.net/index.php
|
|
[3]: https://en.wikipedia.org/wiki/RRDtool
|
|
[4]: https://www.cacti.net/download_cacti.php
|
|
[5]: https://www.nagios.org/projects/nagios-core/
|
|
[6]: https://exchange.nagios.org/directory/Addons/Frontends-%28GUIs-and-CLIs%29/Web-Interfaces/Nagios-V-2DShell/details
|
|
[7]: https://exchange.nagios.org/directory/Addons/Graphing-and-Trending/nagiosgraph/details#_ga=2.79847774.890594951.1545045715-2010747642.1545045715
|
|
[8]: https://www.nagios.org/downloads/nagios-core/
|
|
[9]: https://icinga.com/products/icinga-2/
|
|
[10]: https://icinga.com/download/
|
|
[11]: https://www.zabbix.com/
|
|
[12]: https://www.zabbix.com/download
|
|
[13]: https://prometheus.io/
|
|
[14]: https://prometheus.io/docs/alerting/alertmanager/
|
|
[15]: https://prometheus.io/download/
|