sources/tech/20210601 Start monitoring your Kubernetes cluster with Prometheus and Grafana.md
18 KiB
Start monitoring your Kubernetes cluster with Prometheus and Grafana
Before you can measure chaos, you need to know what your system's steady
state looks like. Learn how in the second article in this series about
chaos engineering.

In my introductory article about chaos engineering, one of the main things I covered was the importance of getting the steady state of your working Kubernetes cluster. Before you can start causing chaos, you need to know what the cluster looks like in a steady state.
This article will cover how to get those metrics using Prometheus and Grafana. This walkthrough also uses Pop!_OS 20.04, Helm 3, Minikube 1.14.2, and Kubernetes 1.19.
Configure Minikube
Install Minikube in whatever way makes sense for your environment. If you have enough resources, I recommend giving your virtual machine a bit more than the default memory and CPU power:
$ minikube config set memory 8192
❗  These changes will take effect upon a minikube delete and then a minikube start
$ minikube config set cpus 6
❗  These changes will take effect upon a minikube delete and then a minikube start
Then start and check your system's status:
$ minikube start
😄  minikube v1.14.2 on Debian bullseye/sid
🎉  minikube 1.19.0 is available! Download it: <https://github.com/kubernetes/minikube/releases/tag/v1.19.0>
💡  To disable this notice, run: 'minikube config set WantUpdateNotification false'

✨  Using the docker driver based on user configuration
👍  Starting control plane node minikube in cluster minikube
🔥  Creating docker container (CPUs=6, Memory=8192MB) ...
🐳  Preparing Kubernetes v1.19.0 on Docker 19.03.8 ...
🔎  Verifying Kubernetes components...
🌟  Enabled addons: storage-provisioner, default-storageclass
🏄  Done! kubectl is now configured to use "minikube" by default
$ minikube status
minikube
type: Control Plane
host: Running
kubelet: Running
apiserver: Running
kubeconfig: Configured
Install Prometheus
Once the cluster is set up, start your installations. Install Prometheus first by following the instructions below.
First, add the repository in Helm:
$ helm repo add prometheus-community <https://prometheus-community.github.io/helm-charts>
"prometheus-community" has been added to your repositories
Then install your Prometheus Helm chart. You should see:
$ helm install prometheus prometheus-community/prometheus
NAME: prometheus
LAST DEPLOYED: Sun May  9 11:37:19 2021
NAMESPACE: default
STATUS: deployed
REVISION: 1
TEST SUITE: None
NOTES:
The Prometheus server can be accessed via port 80 on the following DNS name from within your cluster:
prometheus-server.default.svc.cluster.local
Get the Prometheus server URL by running these commands in the same shell:
  export POD_NAME=$(kubectl get pods --namespace default -l "app=prometheus,component=server" -o jsonpath="{.items[0].metadata.name}")
  kubectl --namespace default port-forward $POD_NAME 9090
You can access the Prometheus Alertmanager via port 80 on this DNS name from within your cluster:
`prometheus-alertmanager.default.svc.cluster.local`
Get the Alertmanager URL by running these commands in the same shell:
  export POD_NAME=$(kubectl get pods --namespace default -l "app=prometheus,component=alertmanager" -o jsonpath="{.items[0].metadata.name}")
  kubectl --namespace default port-forward $POD_NAME 9093
#################################################################################
######   WARNING: Pod Security Policy has been moved to a global property.  #####
######            use .Values.podSecurityPolicy.enabled with pod-based      #####
######            annotations                                               #####
######            (e.g. .Values.nodeExporter.podSecurityPolicy.annotations) #####
#################################################################################
You can access the Prometheus PushGateway via port 9091 on this DNS name from within your cluster:
`prometheus-pushgateway.default.svc.cluster.local`
Get the PushGateway URL by running these commands in the same shell:
  export POD_NAME=$(kubectl get pods --namespace default -l "app=prometheus,component=pushgateway" -o jsonpath="{.items[0].metadata.name}")
  kubectl --namespace default port-forward $POD_NAME 9091

For more information on running Prometheus, visit:
<https://prometheus.io/>
Check to confirm your pods are running:
$ kubectl get pods -n default
NAME                                             READY   STATUS    RESTARTS   AGE
prometheus-alertmanager-ccf8f68cd-hcrqr          2/2     Running   0          3m22s
prometheus-kube-state-metrics-685b975bb7-mhv54   1/1     Running   0          3m22s
prometheus-node-exporter-mfcwj                   1/1     Running   0          3m22s
prometheus-pushgateway-74cb65b858-7ffhs          1/1     Running   0          3m22s
prometheus-server-d9fb67455-2g2jw                2/2     Running   0          3m22s
Next, expose your port on the Prometheus server pod so that you can see the Prometheus web interface. To do this, you need the service name and port. You also need to come up with a name to open the service using the Minikube service command.
Get the service name for prometheus-server:
$ kubectl get svc -n default
NAME                            TYPE        CLUSTER-IP       EXTERNAL-IP   PORT(S)        AGE
kubernetes                      ClusterIP   10.96.0.1        <none>        443/TCP        13m
prometheus-alertmanager         ClusterIP   10.106.68.12     <none>        80/TCP         8m22s
prometheus-kube-state-metrics   ClusterIP   10.104.167.239   <none>        8080/TCP       8m22s
prometheus-node-exporter        ClusterIP   None             <none>        9100/TCP       8m22s
prometheus-pushgateway          ClusterIP   10.99.90.233     <none>        9091/TCP       8m22s
prometheus-server               ClusterIP   10.103.195.104   <none>        9090/TCP       8m22s
Expose the service as type Node-port. Provide a target port of 9090 and a name you want to call the server. The node port is the server listening port. This is an extract of the Helm chart:
    ## Port for Prometheus Service to listen on
    ##
    port: 9090
The command is:
$ kubectl expose service prometheus-server --type=NodePort --target-port=9090 --name=prom-server
service/prom-server exposed
Next, you need Minikube to open the service and browser:
jess@Athena:~$ minikube service prom-server
|-----------|-------------|-------------|---------------------------|
| NAMESPACE |    NAME     | TARGET PORT |            URL            |
|-----------|-------------|-------------|---------------------------|
| default   | prom-server |          80 | <http://192.168.49.2:32169> |
|-----------|-------------|-------------|---------------------------|
🎉  Opening service default/prom-server in default browser...
Your browser should open and show you the Prometheus service.
(Jess Cherry, CC BY-SA 4.0)
Congratulations! You now have Prometheus installed on your cluster.
Install Grafana
Next, install Grafana and configure it to work with Prometheus. Follow the steps below to expose a service to configure Grafana and collect data from Prometheus to gather your steady state.
Start with getting your Helm chart:
$ helm repo add grafana <https://grafana.github.io/helm-charts>
"grafana" has been added to your repositories
Search for your chart:
$ helm search repo grafana
NAME                                            CHART VERSION   APP VERSION     DESCRIPTION
bitnami/grafana       5.2.11      7.5.5         Grafana is an open source, feature rich metrics...
bitnami/grafana-operator       0.6.5      3.10.0   Kubernetes Operator based on the Operator SDK f...
grafana/grafana    6.9.0                7.5.5           The leading tool for querying and visualizing t...
stable/grafana    5.5.7         7.1.1           DEPRECATED - The leading tool for querying and ...
Since stable/grafana is depreciated, install bitnami/grafana. Then install your chart:
helm install grafana bitnami/grafana
NAME: grafana
LAST DEPLOYED: Sun May  9 12:09:53 2021
NAMESPACE: default
STATUS: deployed
REVISION: 1
TEST SUITE: None
NOTES:
** Please be patient while the chart is being deployed **
- Get the application URL by running: [code] echo "Browse to http://127.0.0.1:8080" kubectl port-forward svc/grafana 8080:3000 &
  2. Get the admin credentials: [code] echo "User: admin"
echo "Password: $(kubectl get secret grafana-admin --namespace default -o jsonpath="{.data.GF_SECURITY_ADMIN_PASSWORD}" | base64 --decode)"
As you can see in the Helm installation output, the target port for Grafana is 3000, so you will use that port for exposing the service to see Grafana's web frontend. Before exposing the service, confirm your services are running:
$ kubectl get pods -A
NAMESPACE     NAME                                             READY   STATUS    RESTARTS   AGE
default       grafana-6b84bbcd8f-xt6vd                         1/1     Running   0          4m21s
Expose the service:
$ kubectl expose service grafana --type=NodePort --target-port=3000 --name=grafana-server
service/grafana-server exposed
Enable the service to open a browser with a Minikube service:
jess@Athena:~$ minikube service grafana-server
|-----------|----------------|-------------|---------------------------|
| NAMESPACE |      NAME      | TARGET PORT |            URL            |
|-----------|----------------|-------------|---------------------------|
| default   | grafana-server |        3000 | <http://192.168.49.2:30549> |
|-----------|----------------|-------------|---------------------------|
🎉  Opening service default/grafana-server in default browser...
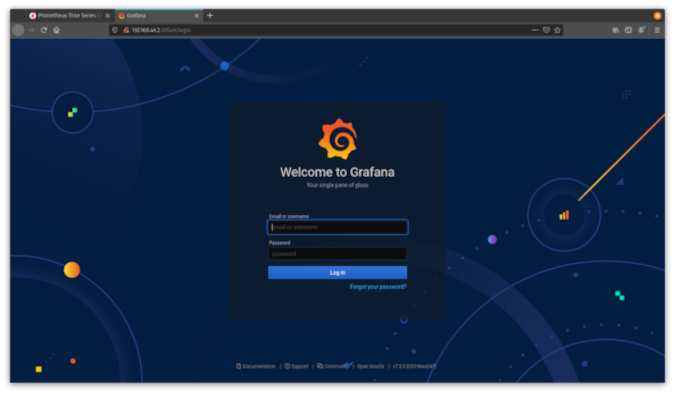
You will see the welcome screen where you can log in.
(Jess Cherry, CC BY-SA 4.0)
Set up credentials to log into Grafana using kubectl. The commands appeared in the installation's output; here are the commands in use:
$ echo "User: admin"
User: admin
$ echo "Password: $(kubectl get secret grafana-admin --namespace default -o jsonpath="{.data.GF_SECURITY_ADMIN_PASSWORD}" | base64 --decode)"
Password: G6U5VeAejt
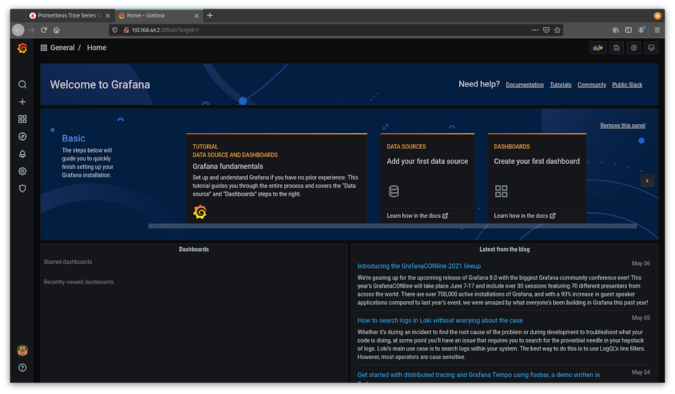
Log in with your new credentials, and you will see the Grafana dashboard.
(Jess Cherry, CC BY-SA 4.0)
Congratulations! You now have a working Grafana installation in your Minikube cluster with the ability to log in. The next step is to configure Grafana to work with Prometheus to gather data and show your steady state.
Configure Grafana with Prometheus
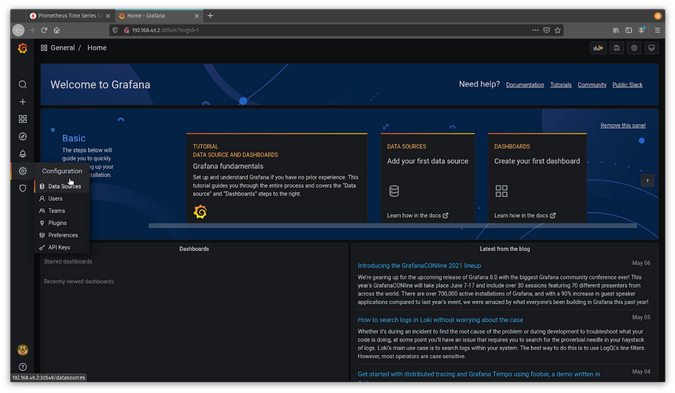
Now that you can log in to your Grafana instance, you need to set up the data collection and dashboard. Since this is an entirely web-based configuration, I will go through the setup using screenshots. Start by adding your Prometheus data collection. Click the gear icon on the left-hand side of the display to open the Configuration settings, then select Data Source.
(Jess Cherry, CC BY-SA 4.0)
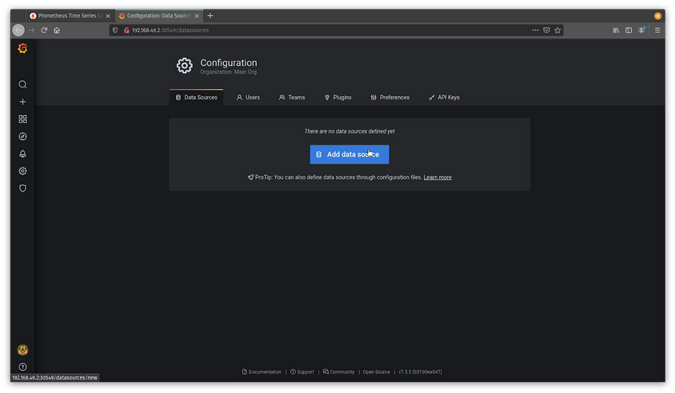
On the next screen, click Add data source.
(Jess Cherry, CC BY-SA 4.0)
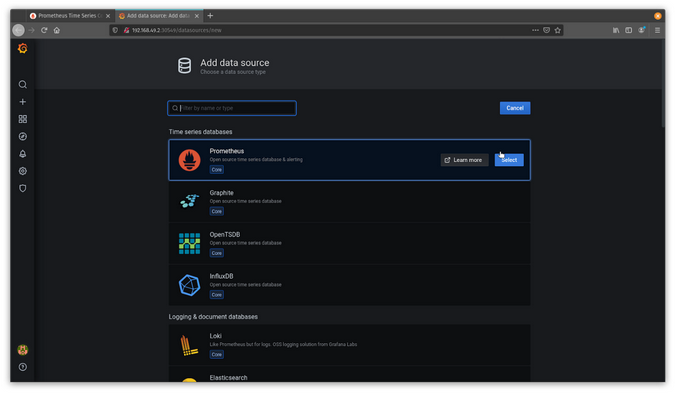
Select Prometheus.
(Jess Cherry, CC BY-SA 4.0)
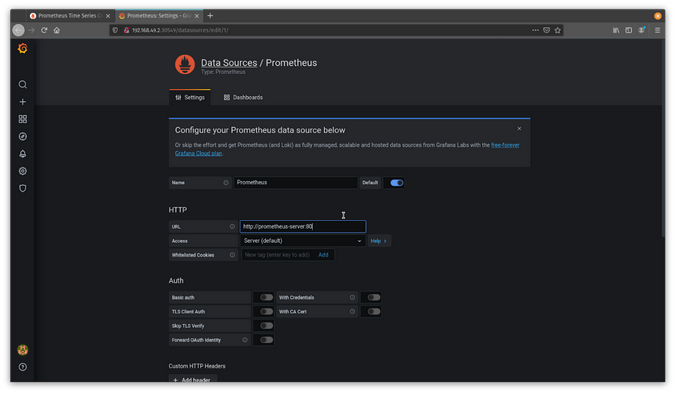
Because you configured your Prometheus instance to be exposed on port 80, use the service name prometheus-server and the server port 80.
(Jess Cherry, CC BY-SA 4.0)
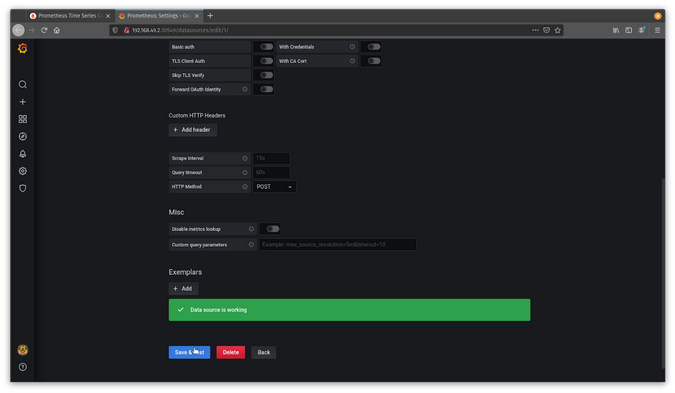
Save and test your new data source by scrolling to the bottom of the screen and clicking Save and Test. You should see a green banner that says Data source is working.
(Jess Cherry, CC BY-SA 4.0)
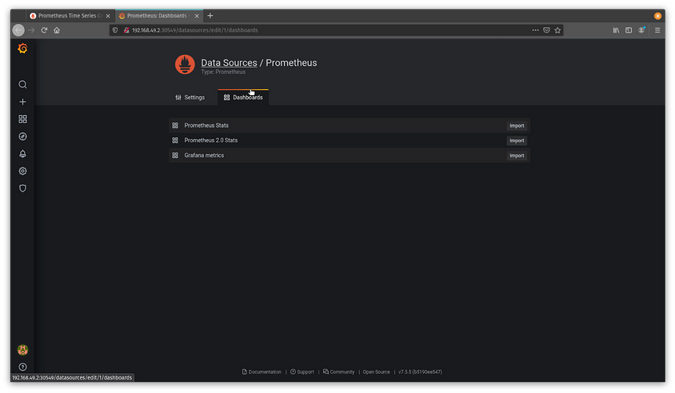
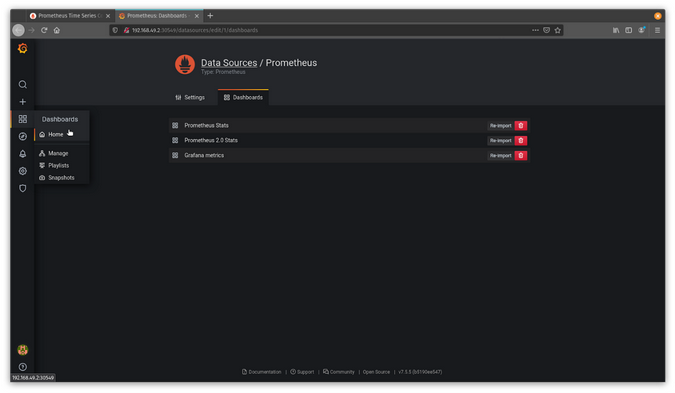
Return to the top of the page and click Dashboards.
(Jess Cherry, CC BY-SA 4.0)
Import all three dashboard options.
(Jess Cherry, CC BY-SA 4.0)
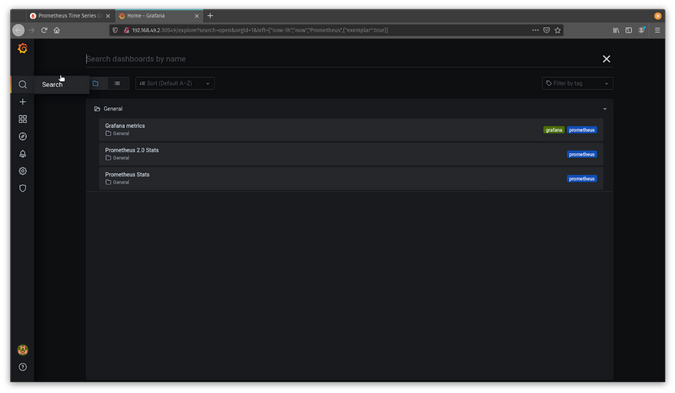
Click the magnifying glass icon on the left-hand side to confirm all three dashboards have been imported.
(Jess Cherry, CC BY-SA 4.0)
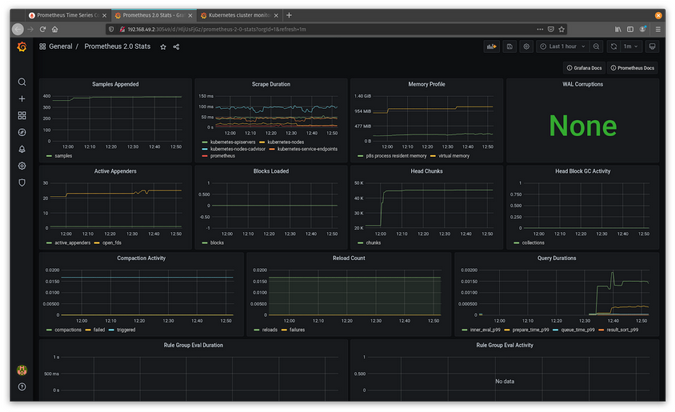
Now that everything is configured, click Prometheus 2.0 Stats, and you should see something similar to this.
(Jess Cherry, CC BY-SA 4.0)
Congratulations! You have a set up basic data collection from Prometheus about your cluster.
Import more monitoring dashboards
You can import additional detailed dashboards from Grafana Labs' community dashboards collection. I picked two of my favorites, Dash-minikube and Kubernetes Cluster Monitoring, for this quick walkthrough.
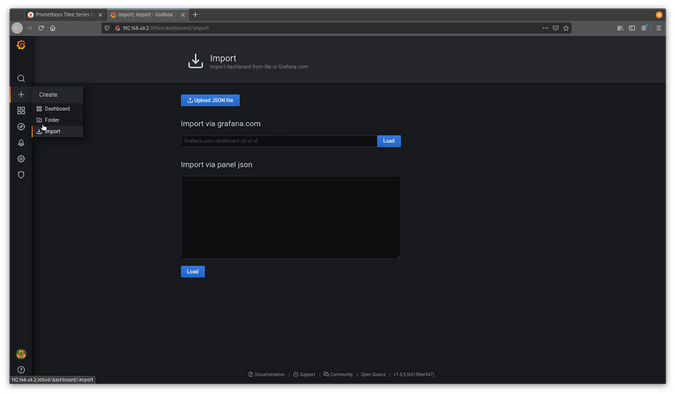
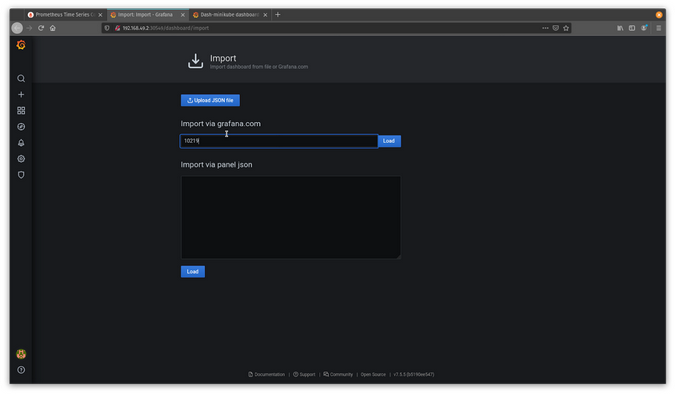
To import a dashboard, you need its ID from the dashboards collection. First, click the plus (+) sign on the left-hand side to create a dashboard, then click Import in the dropdown list, and enter the ID. For Dash-minikube, it's ID 10219.
(Jess Cherry, CC BY-SA 4.0)
(Jess Cherry, CC BY-SA 4.0)
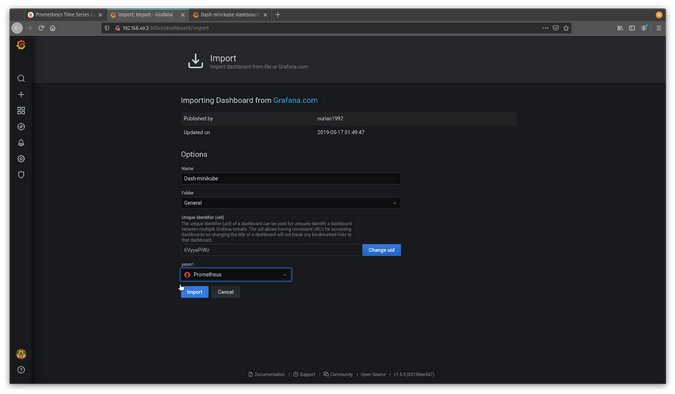
Click Load, and enter the data source on the next screen. Since this uses Prometheus, enter your Prometheus data source.
(Jess Cherry, CC BY-SA 4.0)
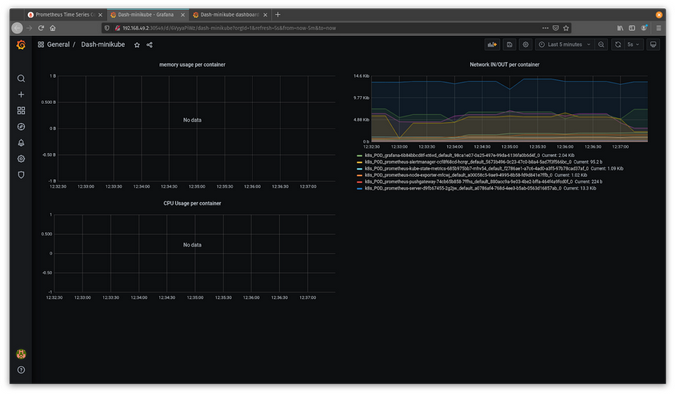
Click Import, and the new dashboard will appear.
(Jess Cherry, CC BY-SA 4.0)
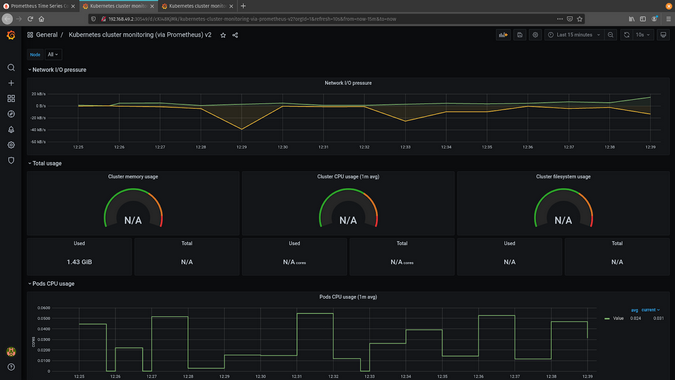
Now you have a new dashboard to keep track of your Minikube stats. If you follow the same steps using Kubernetes Cluster Monitoring (ID 2115), you will see a more verbose monitoring dashboard.
(Jess Cherry, CC BY-SA 4.0)
Now you can keep track of your steady state with Grafana and Prometheus data collections and visuals.
Final thoughts
With these open source tools, you can collect your cluster's steady state and maintain a good pulse on it. This is important in chaos engineering because it allows you to check everything in a destructive, unstable state and use that data to test your hypothesis about what could happen to its state during an outage.
via: https://opensource.com/article/21/6/chaos-grafana-prometheus
作者:Jessica Cherry 选题:lujun9972 译者:译者ID 校对:校对者ID

