28 KiB
A hands-on tutorial for using the GNU Project Debugger
The GNU Project Debugger is a powerful tool for finding bugs in
programs.

If you're a programmer and you want to put a certain functionality in your software, you start by thinking of ways to implement it—such as writing a method, defining a class, or creating new data types. Then you write the implementation in a language that the compiler or interpreter can understand. But what if the compiler or interpreter does not understand the instructions as you had them in mind, even though you're sure you did everything right? What if the software works fine most of the time but causes bugs in certain circumstances? In these cases, you have to know how to use a debugger correctly to find the source of your troubles.
The GNU Project Debugger (GDB) is a powerful tool for finding bugs in programs. It helps you uncover the reason for an error or crash by tracking what is going on inside the program during execution.
This article is a hands-on tutorial on basic GDB usage. To follow along with the examples, open the command line and clone this repository:
`git clone https://github.com/hANSIc99/core_dump_example.git`
Shortcuts
Every command in GDB can be shortened. For example, info break, which shows the set breakpoints, can be shortened to i break. You might see those abbreviations elsewhere, but in this article, I will write out the entire command so that it is clear which function is used.
Command-line parameters
You can attach GDB to every executable. Navigate to the repository you cloned, and compile it by running make. You should now have an executable called coredump. (See my article on Creating and debugging Linux dump files for more information..
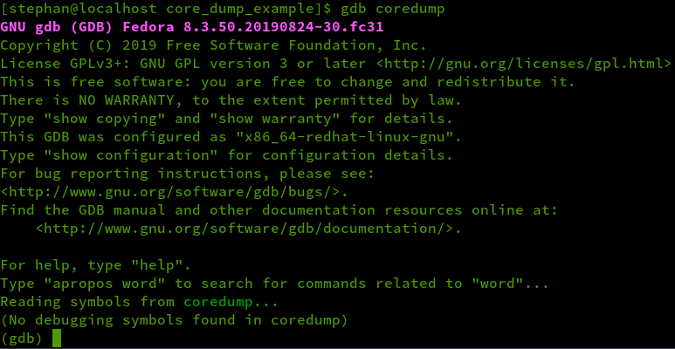
To attach GDB to the executable, type: gdb coredump.
Your output should look like this:
(Stephan Avenwedde, CC BY-SA 4.0)
It says no debugging symbols were found.
Debugging information is part of the object file (the executable) and includes data types, function signatures, and the relationship between the source code and the opcode. At this point, you have two options:
- Continue debugging the assembly (see "Debug without symbols" below)
- Compile with debug information using the information in the next section
Compile with debug information
To include debug information in the binary file, you have to recompile it. Open the Makefile and remove the hashtag (#) from line 9:
`CFLAGS =-Wall -Werror -std=c++11 -g`
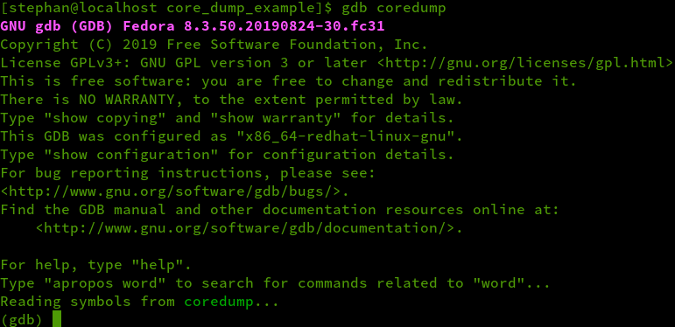
The g option tells the compiler to include the debug information. Run make clean followed by make and invoke GDB again. You should get this output and can start debugging the code:
(Stephan Avenwedde, CC BY-SA 4.0)
The additional debugging information will increase the size of the executable. In this case, it increases the executable by 2.5 times (from 26,088 byte to 65,480 byte).
Start the program with the -c1 switch by typing run -c1. The program will start and crash when it reaches State_4:
(Stephan Avenwedde, CC BY-SA 4.0)
You can retrieve additional information about the program. The command info source provides information about the current file:
(Stephan Avenwedde, CC BY-SA 4.0)
- 101 lines
- Language: C++
- Compiler (version, tuning, architecture, debug flag, language standard)
- Debugging format: DWARF 2
- No preprocessor macro information available (when compiled with GCC, macros are available only when compiled with the
-g3flag).
The command info shared prints a list of dynamic libraries with their addresses in the virtual address space that was loaded on startup so that the program will execute:
(Stephan Avenwedde, CC BY-SA 4.0)
If you want to learn about library handling in Linux, see my article How to handle dynamic and static libraries in Linux.
Debug the program
You may have noticed that you can start the program inside GDB with the run command. The run command accepts command-line arguments like you would use to start the program from the console. The -c1 switch will cause the program to crash on stage 4. To run the program from the beginning, you don't have to quit GDB; simply use the run command again. Without the -c1 switch, the program executes an infinite loop. You would have to stop it with Ctrl+C.
(Stephan Avenwedde, CC BY-SA 4.0)
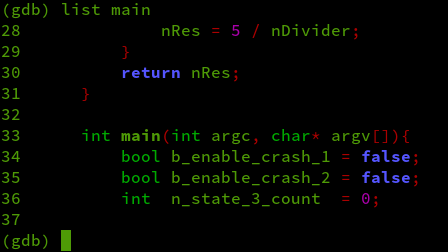
You can also execute a program step by step. In C/C++, the entry point is the main function. Use the command list main to open the part of the source code that shows the main function:
(Stephan Avenwedde, CC BY-SA 4.0)
The main function is on line 33, so add a breakpoint there by typing break 33:
(Stephan Avenwedde, CC BY-SA 4.0)
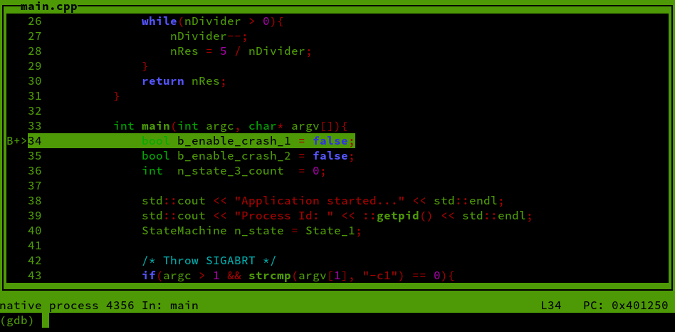
Run the program by typing run. As expected, the program stops at the main function. Type layout src to show the source code in parallel:
(Stephan Avenwedde, CC BY-SA 4.0)
You are now in GDB's text user interface (TUI) mode. Use the Up and Down arrow keys to scroll through the source code.
GDB highlights the line to be executed. By typing next (n), you can execute the commands line by line. GBD executes the last command if you don't specify a new one. To step through the code, just hit the Enter key.
From time to time, you will notice that TUI's output gets a bit corrupted:
(Stephan Avenwedde, CC BY-SA 4.0)
If this happens, press Ctrl+L to reset the screen.
Use Ctrl+X+A to enter and leave TUI mode at will. You can find other key bindings in the manual.
To quit GDB, simply type quit.
Watchpoints
The heart of this example program consists of a state machine running in an infinite loop. The variable n_state is a simple enum that determines the current state:
while(true){
        switch(n_state){
        case State_1:
                std::cout << "State_1 reached" << std::flush;
                n_state = State_2;
                break;
        case State_2:
                std::cout << "State_2 reached" << std::flush;
                n_state = State_3;
                break;

        (.....)

        }
}
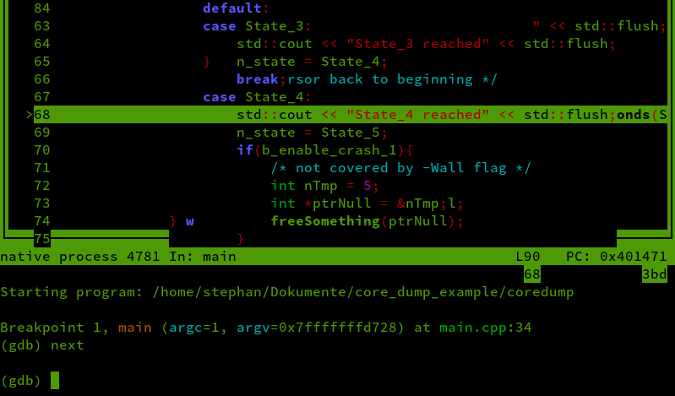
You want to stop the program when n_state is set to the value State_5. To do so, stop the program at the main function and set a watchpoint for n_state:
`watch n_state == State_5`
Setting watchpoints with the variable name works only if the desired variable is available in the current context.
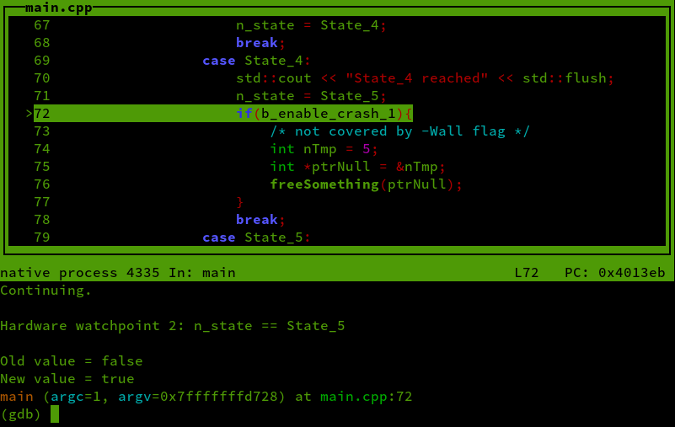
When you continue the program's execution by typing continue, you should get output like:
(Stephan Avenwedde, CC BY-SA 4.0)
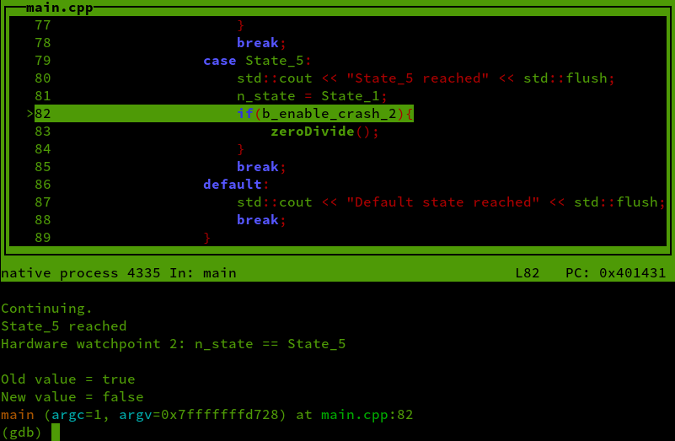
If you continue the execution, GDB will stop when the watchpoint expression evaluates to false:
(Stephan Avenwedde, CC BY-SA 4.0)
You can specify watchpoints for general value changes, specific values, and read or write access.
Altering breakpoints and watchpoints
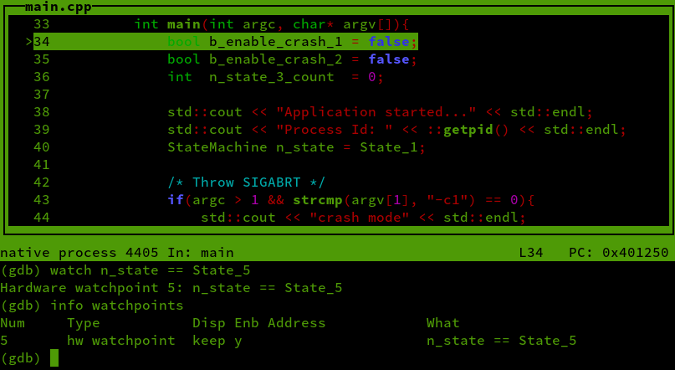
Type info watchpoints to print a list of previously set watchpoints:
(Stephan Avenwedde, CC BY-SA 4.0)
Delete breakpoints and watchpoints
As you can see, watchpoints are numbers. To delete a specific watchpoint, type delete followed by the number of the watchpoint. For example, my watchpoint has the number 2; to remove this watchpoint, enter delete 2.
Caution: If you use delete without specifying a number, all watchpoints and breakpoints will be deleted.
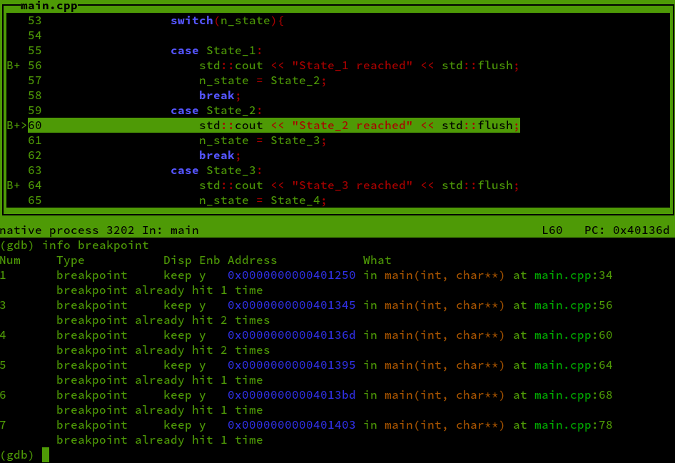
The same applies to breakpoints. In the screenshot below, I added several breakpoints and printed a list of them by typing info breakpoint:
(Stephan Avenwedde, CC BY-SA 4.0)
To remove a single breakpoint, type delete followed by its number. Alternatively, you can remove a breakpoint by specifying its line number. For example, the command clear 78 will remove breakpoint number 7, which is set on line 78.
Disable or enable breakpoints and watchpoints
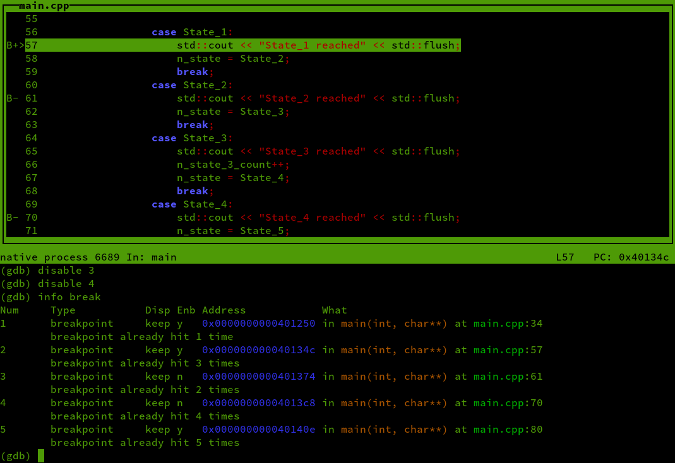
Instead of removing a breakpoint or watchpoint, you can disable it by typing disable followed by its number. In the following, breakpoints 3 and 4 are disabled and are marked with a minus sign in the code window:
(Stephan Avenwedde, CC BY-SA 4.0)
It is also possible to modify a range of breakpoints or watchpoints by typing something like disable 2 - 4. If you want to reactivate the points, type enable followed by their numbers.
Conditional breakpoints
First, remove all breakpoints and watchpoints by typing delete. You still want the program to stop at the main function, but instead of specifying a line number, add a breakpoint by naming the function directly. Type break main to add a breakpoint at the main function.
Type run to start the execution from the beginning, and the program will stop at the main function.
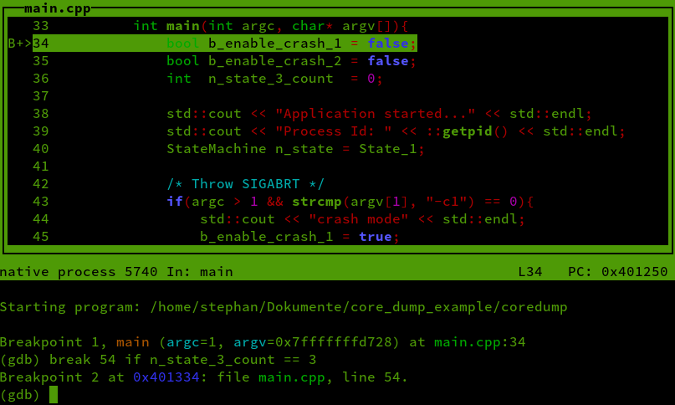
The main function includes the variable n_state_3_count, which is incremented when the state machine hits state 3.
To add a conditional breakpoint based on the value of n_state_3_count type:
`break 54 if n_state_3_count == 3`
(Stephan Avenwedde, CC BY-SA 4.0)
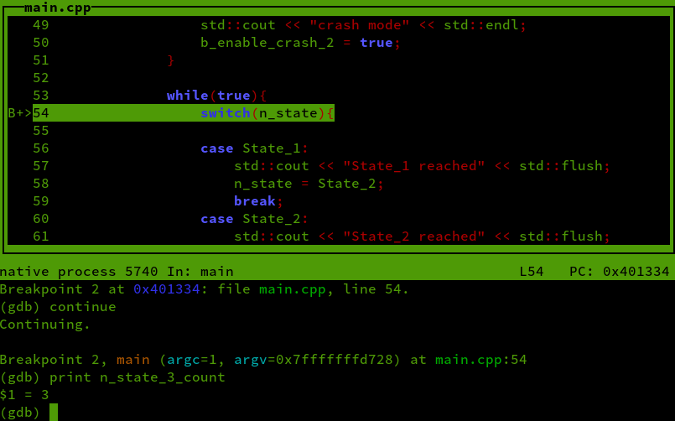
Continue the execution. The program will execute the state machine three times before it stops at line 54. To check the value of n_state_3_count, type:
`print n_state_3_count`
(Stephan Avenwedde, CC BY-SA 4.0)
Make breakpoints conditional
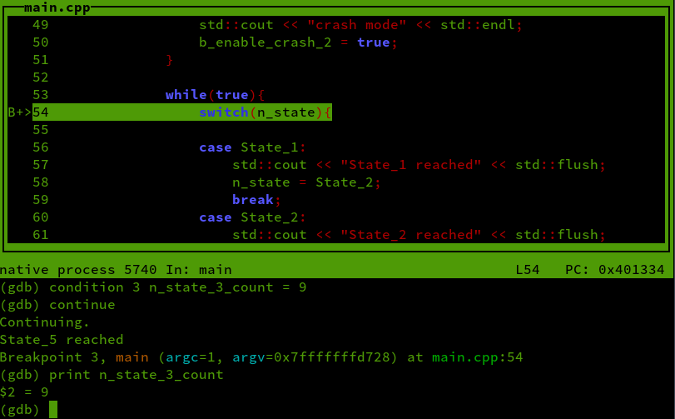
It is also possible to make an existing breakpoint conditional. Remove the recently added breakpoint with clear 54, and add a simple breakpoint by typing break 54. You can make this breakpoint conditional by typing:
`condition 3 n_state_3_count == 9`
The 3 refers to the breakpoint number.
(Stephan Avenwedde, CC BY-SA 4.0)
Set breakpoints in other source files
If you have a program that consists of several source files, you can set breakpoints by specifying the file name before the line number, e.g., break main.cpp:54.
Catchpoints
In addition to breakpoints and watchpoints, you can also set catchpoints. Catchpoints apply to program events like performing syscalls, loading shared libraries, or raising exceptions.
To catch the write syscall, which is used to write to STDOUT, enter:
`catch syscall write`
(Stephan Avenwedde, CC BY-SA 4.0)
Each time the program writes to the console output, GDB will interrupt execution.
In the manual, you can find a whole chapter covering break-, watch-, and catchpoints.
Evaluate and manipulate symbols
Printing the values of variables is done with the print command. The general syntax is print <expression> <value>. The value of a variable can be modified by typing:
`set variable <variable-name> <new-value>.`
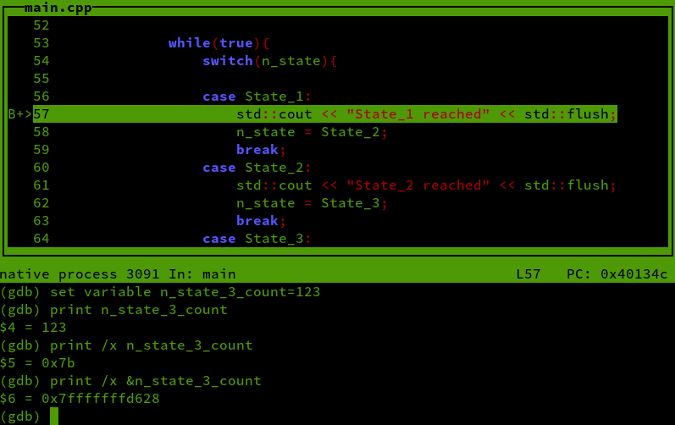
In the screenshot below, I gave the variable n_state_3_count the value 123.
(Stephan Avenwedde, CC BY-SA 4.0)
The /x expression prints the value in hexadecimal; with the & operator, you can print the address within the virtual address space.
If you are not sure of a certain symbol's data type, you can find it with whatis:
(Stephan Avenwedde, CC BY-SA 4.0)
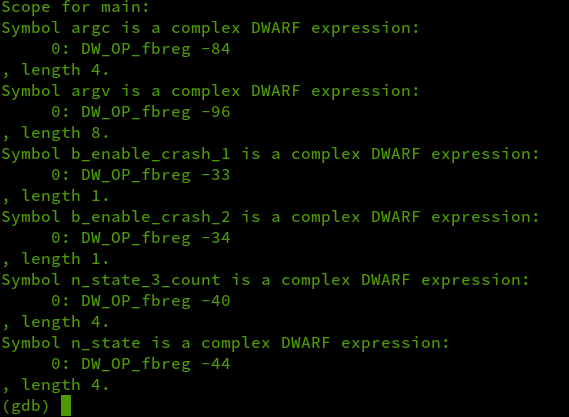
If you want to list all variables that are available in the scope of the main function, type info scope main:
(Stephan Avenwedde, CC BY-SA 4.0)
The DW_OP_fbreg values refer to the stack offset based on the current subroutine.
Alternatively, if you are already inside a function and want to list all variables on the current stack frame, you can use info locals:
(Stephan Avenwedde, CC BY-SA 4.0)
Check the manual to learn more about examining symbols.
Attach to a running process
The command gdb attach <process-id> allows you to attach to an already running process by specifying the process ID (PID). Luckily, the coredump program prints its current PID to the screen, so you don't have to manually find it with ps or top.
Start an instance of the coredump application:
`./coredump`
(Stephan Avenwedde, CC BY-SA 4.0)
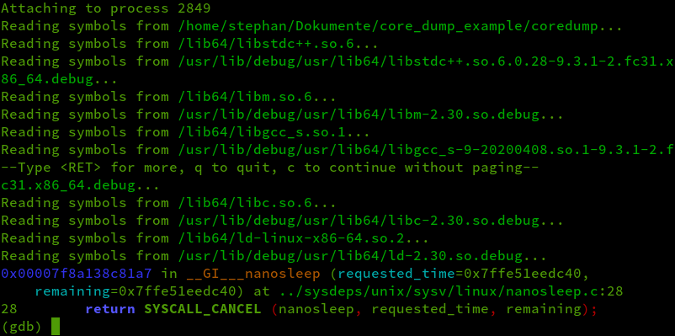
The operating system gives the PID 2849. Open a separate console window, move to the coredump application's source directory, and attach GDB:
`gdb attach 2849`
(Stephan Avenwedde, CC BY-SA 4.0)
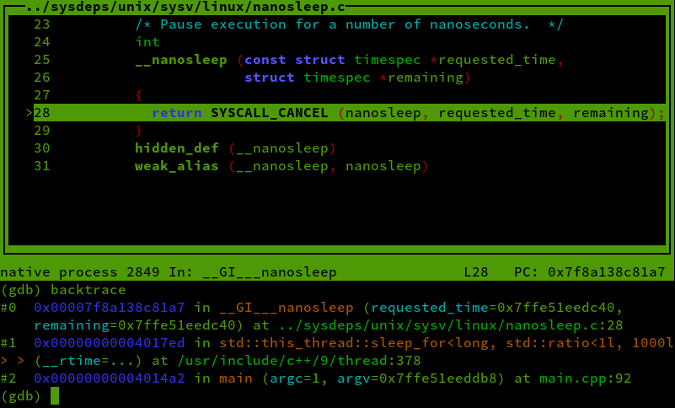
GDB immediately stops the execution when you attach it. Type layout src and backtrace to examine the call stack:
(Stephan Avenwedde, CC BY-SA 4.0)
The output shows the process interrupted while executing the std::this_thread::sleep_for<...>(...) function that was called in line 92 of main.cpp.
As soon as you quit GDB, the process will continue running.
You can find more information about attaching to a running process in the GDB manual.
Move through the stack
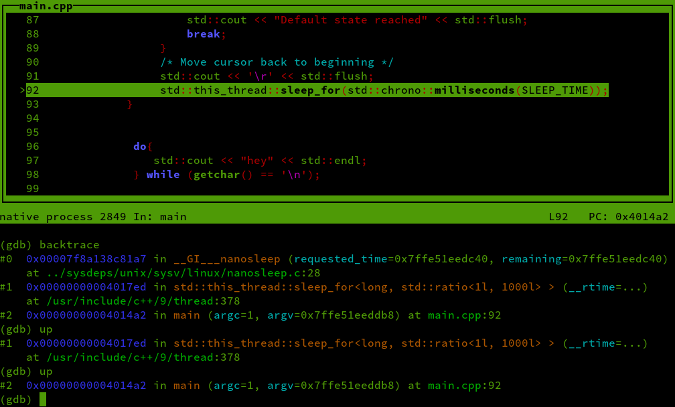
Return to the program by using up two times to move up in the stack to main.cpp:
(Stephan Avenwedde, CC BY-SA 4.0)
Usually, the compiler will create a subroutine for each function or method. Each subroutine has its own stack frame, so moving upwards in the stackframe means moving upwards in the callstack.
You can find out more about stack evaluation in the manual.
Specify the source files
When attaching to an already running process, GDB will look for the source files in the current working directory. Alternatively, you can specify the source directories manually with the directory command.
Evaluate dump files
Read Creating and debugging Linux dump files for information about this topic.
TL;DR:
-
I assume you're working with a recent version of Fedora
-
Invoke coredump with the c1 switch:
coredump -c1
(Stephan Avenwedde, CC BY-SA 4.0)
-
Load the latest dumpfile with GDB:
coredumpctl debug -
Open TUI mode and enter
layout src
(Stephan Avenwedde, CC BY-SA 4.0)
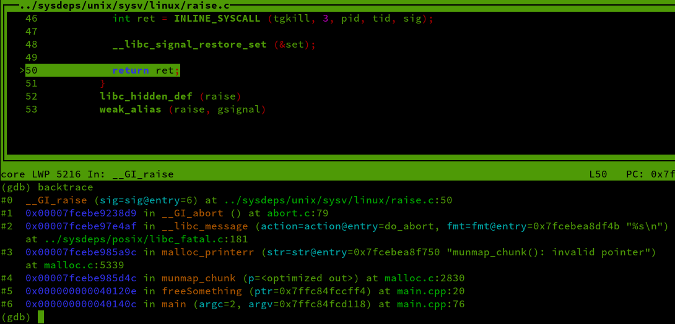
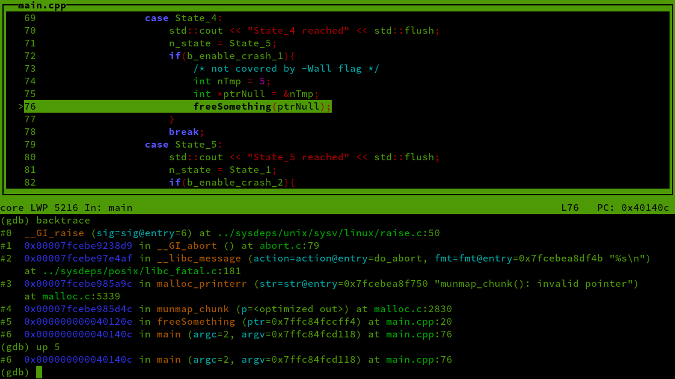
The output of backtrace shows that the crash happened five stack frames away from main.cpp. Enter to jump directly to the faulty line of code in main.cpp:
(Stephan Avenwedde, CC BY-SA 4.0)
A look at the source code shows that the program tried to free a pointer that was not returned by a memory management function. This results in undefined behavior and caused the SIGABRT.
Debug without symbols
If there are no sources available, things get very hard. I had my first experience with this when trying to solve reverse-engineering challenges. It is also useful to have some knowledge of assembly language.
Check out how it works with this example.
Go to the source directory, open the Makefile, and edit line 9 like this:
`CFLAGS =-Wall -Werror -std=c++11 #-g`
To recompile the program, run make clean followed by make and start GDB. The program no longer has any debugging symbols to lead the way through the source code.
(Stephan Avenwedde, CC BY-SA 4.0)
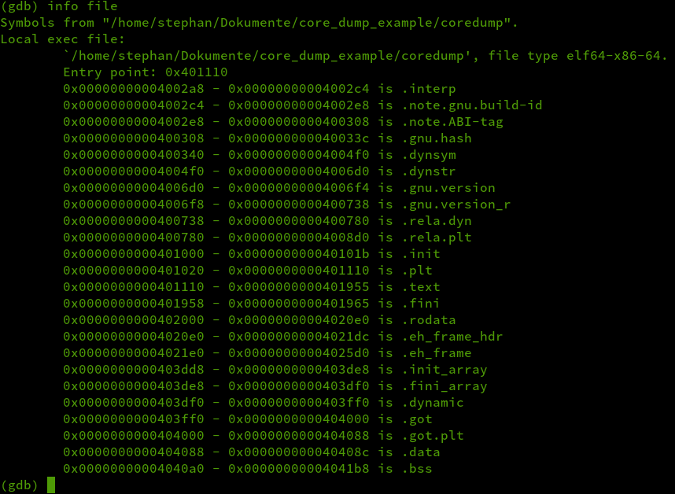
The command info file reveals the memory areas and entry point of the binary:
(Stephan Avenwedde, CC BY-SA 4.0)
The entry point corresponds with the beginning of the .text area, which contains the actual opcode. To add a breakpoint at the entry point, type break *0x401110 then start execution by typing run:
(Stephan Avenwedde, CC BY-SA 4.0)
To set up a breakpoint at a certain address, specify it with the dereferencing operator *.
Choose the disassembler flavor
Before digging deeper into assembly, you can choose which assembly flavor to use. GDB's default is AT&T, but I prefer the Intel syntax. Change it with:
`set disassembly-flavor intel`
(Stephan Avenwedde, CC BY-SA 4.0)
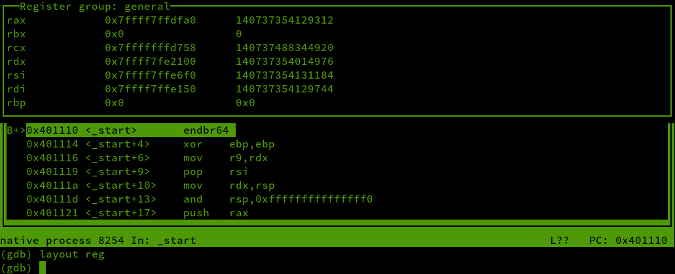
Now open the assembly and register the window by typing layout asm and layout reg. You should now see output like this:
(Stephan Avenwedde, CC BY-SA 4.0)
Save configuration files
Although you have already entered many commands, you haven't actually started debugging. If you are heavily debugging an application or trying to solve a reverse-engineering challenge, it can be useful to save your GDB-specific settings in a file.
The config file gdbinit in this project's GitHub repository contains the recently used commands:
set disassembly-flavor intel
set write on
break *0x401110
run -c2
layout asm
layout reg
The set write on command enables you to modify the binary during execution.
Quit GDB and reopen it with the configuration file: gdb -x gdbinit coredump.
Read instructions
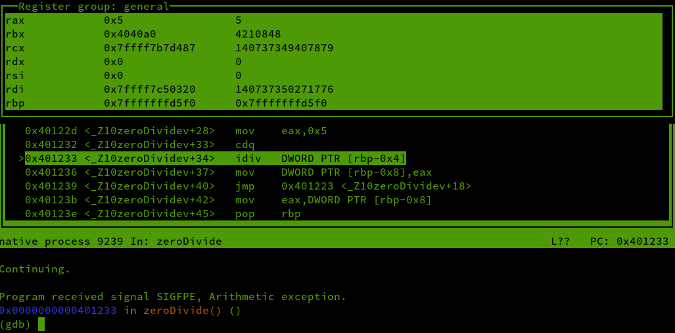
With the c2 switch applied, the program will crash. The program stops at the entry function, so you have to write continue to proceed with execution:
(Stephan Avenwedde, CC BY-SA 4.0)
The idiv instruction performs an integer division with the dividend in the RAX register and the divisor specified as an argument. The quotient is loaded into the RAX register, and the remainder is loaded into RDX.
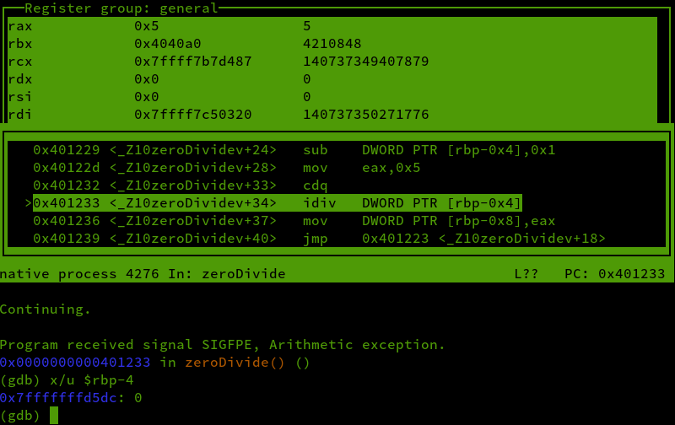
From the register overview, you can see the RAX contains 5, so you have to find out which value is stored on the stack at position RBP-0x4.
Read memory
To read raw memory content, you must specify a few more parameters than for reading symbols. When you scroll up a bit in the assembly output, you can see the division of the stack:
(Stephan Avenwedde, CC BY-SA 4.0)
You're most interested in the value of rbp-0x4 because this is the position where the argument for idiv is stored. From the screenshot, you can see that the next variable is located at rbp-0x8, so the variable at rbp-0x4 is 4 bytes wide.
In GDB, you can use the x command to examine any memory content:
x/< optional parameternfu> < memory addressaddr>
Optional parameters:
n: Repeat count (default: 1) refers to the unit sizef: Format specifier, like in printfu: Unit sizeb: bytesh: half words (2 bytes)w: word (4 bytes)(default)g: giant word (8 bytes)
To print out the value at rbp-0x4, type x/u $rbp-4:
(Stephan Avenwedde, CC BY-SA 4.0)
If you keep this pattern in mind, it's straightforward to examine the memory. Check the examining memory section in the manual.
Manipulate the assembly
The arithmetic exception happened in the subroutine zeroDivide(). When you scroll a bit upward with the Up arrow key, you can find this pattern:
0x401211 <_Z10zeroDividev>              push   rbp
0x401212 <_Z10zeroDividev+1>            mov    rbp,rsp
This is called the function prologue:
- The base pointer (
rbp) of the calling function is stored on the stack - The value of the stack pointer (
rsp) is loaded to the base pointer (rbp)
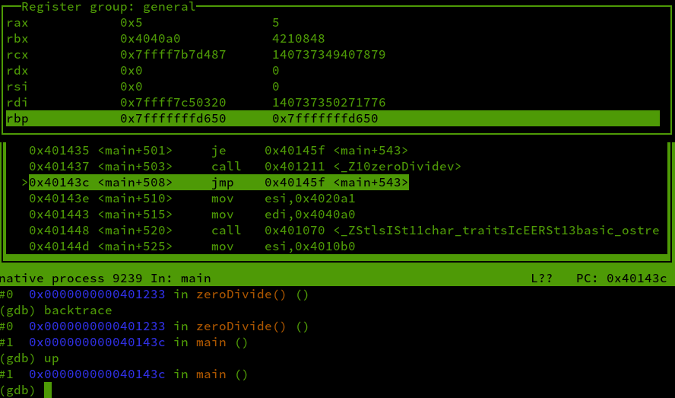
Skip this subroutine completely. You can check the call stack with backtrace. You are only one stack frame ahead of your main function, so you can go back to main with a single up:
(Stephan Avenwedde, CC BY-SA 4.0)
In your main function, you can find this pattern:
0x401431 <main+497>     cmp    BYTE PTR [rbp-0x12],0x0
0x401435 <main+501>     je     0x40145f <main+543>
0x401437 <main+503>     call   0x401211<_Z10zeroDividev>
The subroutine zeroDivide() is entered only when jump equal (je) evaluates to true. You can easily replace this with a jump-not-equal (jne) instruction, which has the opcode 0x75 (provided you are on an x86/64 architecture; the opcodes are different on other architectures). Restart the program by typing run. When the program stops at the entry function, manipulate the opcode by typing:
`set *(unsigned char*)0x401435 = 0x75`
Finally, type continue. The program will skip the subroutine zeroDivide() and won't crash anymore.
Conclusion
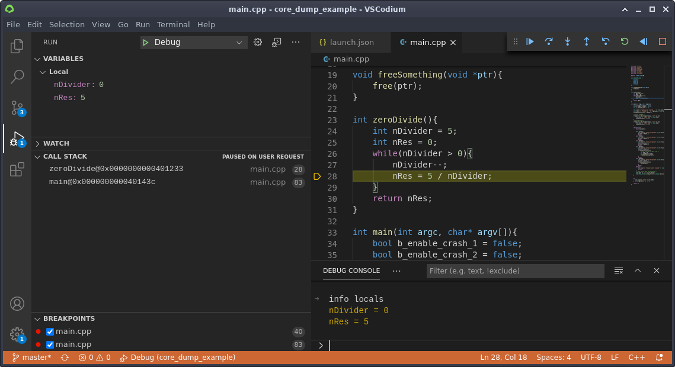
You can find GDB working in the background in many integrated development environments (IDEs), including Qt Creator and the Native Debug extension for VSCodium.
(Stephan Avenwedde, CC BY-SA 4.0)
It's useful to know how to leverage GDB's functionality. Usually, not all of GDB's functions can be used from the IDE, so you benefit from having experience using GDB from the command line.
via: https://opensource.com/article/21/1/gnu-project-debugger
作者:Stephan Avenwedde 选题:lujun9972 译者:译者ID 校对:校对者ID
