mirror of
https://github.com/LCTT/TranslateProject.git
synced 2025-02-28 01:01:09 +08:00
125 lines
5.1 KiB
Markdown
125 lines
5.1 KiB
Markdown
翻译中 by小眼儿
|
||
|
||
How to set up web-based network traffic monitoring system on Linux
|
||
================================================================================
|
||
When you are tasked with monitoring network traffic on the local network, you can consider many different options to do it, depending on the scale/traffic of the local network, monitoring platforms/interface, types of backend database, etc.
|
||
|
||
[ntopng][1] is an open-source (GPLv3) network traffic analyzer which provides a web interface for real-time network traffic monitoring. It runs on multiple platforms including Linux and MacOS X. ntopng comes with a simple RMON-like agent with built-in web server capability, and uses [Redis][2]-backed key-value server to store time series statistics. You can install ntopng network traffic analyzer on any designated monitoring server connected to your network, and use a web browser to access real-time traffic reports available on the server.
|
||
|
||
In this tutorial, I will describe **how to set up a web-based network traffic monitoring system on Linux by using ntopng.**
|
||
|
||
### Features of ntopng ###
|
||
|
||
- Flow-level, protocol-level real-time analysis of local network traffic.
|
||
- Domain, AS (Autonomous System), VLAN level statistics.
|
||
- Geolocation of IP addresses.
|
||
- Deep packet inspection (DPI) based service discovery (e.g., Google, Facebook).
|
||
- Historical traffic analysis (e.g., hourly, daily, weekly, monthly, yearly).
|
||
- Support for sFlow, NetFlow (v5/v9) and IPFIX through nProbe.
|
||
- Network traffic matrix (who’s talking to who?).
|
||
- IPv6 support.
|
||
|
||
### Install ntopng on Linux ###
|
||
|
||
The official website offers binary packages for [Ubuntu][3] and [CentOS][4]. So if you use either platform, you can install these packages.
|
||
|
||
If you want to build the latest ntopng from [its source][5], follow the instructions below.
|
||
|
||
To build ntopng on Debian, Ubuntu or Linux Mint:
|
||
|
||
$ sudo apt-get install libpcap-dev libglib2.0-dev libgeoip-dev redis-server wget
|
||
$ tar xzf ntopng-1.0.tar.gz
|
||
$ cd ntopng-1.0/
|
||
$ ./configure
|
||
$ make geoip
|
||
$ make
|
||
|
||
In the above steps, “make geoip” will automatically download a free version of GeoIP databases with wget from maxmind.com. So make sure that your system is connected to the network.
|
||
|
||
To build ntopng on Fedora:
|
||
|
||
$ sudo yum install libpcap-devel glib2-devel GeoIP-devel
|
||
libxml2-devel redis wget
|
||
$ tar xzf ntopng-1.0.tar.gz
|
||
$ cd ntopng-1.0/
|
||
$ ./configure
|
||
$ make geoip
|
||
$ make
|
||
|
||
To install ntopng on CentOS or RHEL, first [set up EPEL repository][6], and then follow the same instructions as in [Fedora][7] above.
|
||
|
||
### Configure ntopng on Linux ###
|
||
|
||
After building ntopng, create a configuration directory for ntopng, and prepare default configuration files as follows. I assume that “192.168.1.0/24″ is the CIDR address prefix of your local network.
|
||
|
||
$ sudo mkir /etc/ntopng -p
|
||
|
||
$ sudo -e /etc/ntopng/ntopng.start
|
||
|
||
> --local-networks "192.168.1.0/24"
|
||
>
|
||
> --interface 1
|
||
|
||
$ sudo -e /etc/ntopng/ntopng.conf
|
||
|
||
> -G=/var/run/ntopng.pid
|
||
|
||
Before running ntopng, make sure to first start redis, which is a key-value store for ntopng.
|
||
|
||
To start ntopng on Debian, Ubuntu or Linux Mint:
|
||
|
||
$ sudo /etc/init.d/redis-server restart
|
||
$ sudo ./ntopng
|
||
|
||
To start ntopng on Fedora, CentOS or RHEL:
|
||
|
||
$ sudo service redis restart
|
||
$ sudo ./ntopng
|
||
|
||
By default, ntopng listens on TCP/3000 port. Verify this is the case using the command below.
|
||
|
||
$ sudo netstat -nap|grep ntopng
|
||
|
||
> tcp 0 0 0.0.0.0:3000 0.0.0.0:* LISTEN 29566/ntopng
|
||
|
||
### Monitor Network Traffic in Web-Based Interface ###
|
||
|
||
Once ntopng is successfully running, go to http://<ip-address-of-host>:3000 on your web browser to access the web interface of ntopng.
|
||
|
||
You will see the login screen of ntopng. Use the default username and password: “admin/admin” to log in.
|
||
|
||
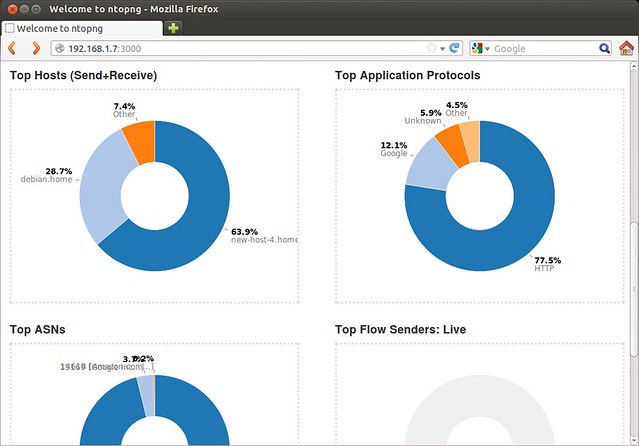
Here are a few screenshots of ntopng in action.
|
||
|
||
Real-time visualization of top flows.
|
||
|
||
[][8]
|
||
|
||
Live statistics of top hosts, top protocols and top AS numbers.
|
||
|
||
[][9]
|
||
|
||
Real time report of active flows with DPI-based automatic application/service discovery.
|
||
|
||
Historic traffic analysis.
|
||
|
||
[][10]
|
||
|
||
--------------------------------------------------------------------------------
|
||
|
||
via: http://xmodulo.com/2013/10/set-web-based-network-traffic-monitoring-linux.html
|
||
|
||
译者:[译者ID](https://github.com/译者ID) 校对:[校对者ID](https://github.com/校对者ID)
|
||
|
||
本文由 [LCTT](https://github.com/LCTT/TranslateProject) 原创翻译,[Linux中国](http://linux.cn/) 荣誉推出
|
||
|
||
[1]:http://www.ntop.org/products/ntop/
|
||
[2]:http://redis.io/
|
||
[3]:http://apt.ntop.org/
|
||
[4]:http://rpm.ntop.org/
|
||
[5]:http://sourceforge.net/projects/ntop/files/ntopng/
|
||
[6]:http://xmodulo.com/2013/03/how-to-set-up-epel-repository-on-centos.html
|
||
[7]:http://xmodulo.com/go/fedora_guide
|
||
[8]:http://www.flickr.com/photos/xmodulo/10487165303/
|
||
[9]:http://www.flickr.com/photos/xmodulo/10486988416/
|
||
[10]:http://www.flickr.com/photos/xmodulo/10486995114/
|