mirror of
https://github.com/LCTT/TranslateProject.git
synced 2025-01-04 22:00:34 +08:00
83 lines
7.6 KiB
Markdown
83 lines
7.6 KiB
Markdown
TimelineJS: An interactive, JavaScript timeline building tool
|
||
======
|
||
Learn how to tell a story with TimelineJS.
|
||

|
||
|
||
[TimelineJS 3][1] is an open source storytelling tool that anyone can use to create visually rich, interactive timelines to post on their websites. To get started, simply click “Make a Timeline” on the homepage and follow the easy [step-by-step instructions][1].
|
||
|
||
TimelineJS was developed at Northwestern University’s KnightLab in Evanston, Illinois. KnightLab is a community of designers, developers, students, and educators who work on experiments designed to push journalism into new spaces. TimelineJS has been used by more than 250,000 people, according to its website, to tell stories viewed millions of times. And TimelineJS3 is available in more than 60 languages.
|
||
|
||
Joe Germuska, the “chief nerd” who runs KnightLab’s technology, professional staff, and student fellows, explains, "TimelineJS was originally developed by Northwestern professor Zach Wise. He assigned his students a task to tell stories in a timeline format, only to find that none of the free available tools were as good as he thought they could be. KnightLab funded some of his time to develop the tool in 2012. Near the end of that year, I joined the lab, and among my early tasks was to bring TimelineJS in as a fully supported project of the lab. The next year, I helped Zach with a rewrite to address some issues. Along the way, many students have contributed. Interestingly, a group of students from Victoria University in Wellington, New Zealand, worked on TimelineJS (and some of our other tools) as part of a class project in 2016."
|
||
|
||
"In general, we designed TimelineJS to make it easy for non-technical people to tell rich, dynamic stories on the web in the context of events in time.”
|
||
|
||
Users create timelines by adding content into a Google spreadsheet. KnightLab provides a downloadable template that can be edited to create custom timelines. Experts can use their JSON skills to [create custom installations][2] while keeping TimelineJS’s core functionality.
|
||
|
||
This easy-to-follow [Vimeo video][3] shows how to get started with TimelineJS, and I used it myself to create my first timeline.
|
||
|
||
### Open sourcing the Adirondacks
|
||
|
||
Reid Larson, research and scholarly communication librarian at Hamilton College in Clinton, New York, began searching for ways to combine open data and visualization to chronicle the history of Essex County (a county in northern New York that makes up part of the Adirondacks), in the 1990s, when he was the director of the Essex County Historical Society/Adirondack History Center Museum.
|
||
|
||
"I wanted to take all the open data available on the history of Essex County and be able to present it to people visually. Most importantly, I wanted to make sure that the data would be available for use even if the applications used to present it are no longer available or supported," Larson explains.
|
||
|
||
Now at Hamilton College, Larson has found TimelineJS to be the ideal open source program to do just what he wanted: Chronicle and present a visually appealing timeline of selected places.
|
||
|
||
"It was a professor who was working on a project that required a solution such as Timeline, and after researching the possibilities, I started using Timeline for that project and subsequent projects," Larson adds.
|
||
|
||
TimelineJS can be used via a web browser, or the source code can be downloaded from [GitHub][4] for local use.
|
||
|
||
"I’ve been using the browser version, but I push it to the limits to see how far I can go with it, such as adding my own HTML tags. I want to fully understand it so that I can educate the students and faculty at Hamilton College on its uses," Larson says.
|
||
|
||
### An open source Eagle Scout project
|
||
|
||
Not only has Larson used TimelineJS for collegiate purposes, but his son, Erik, created an [interactive historical website][5] for his Eagle Scout project in 2017 using WordPress. The project is a chronicle of places in Waterville, New York, just south of Clinton, in Oneida County. Erik explains that he wants what he started to expand beyond the 36 places in Waterville. "The site is an experiment in online community building," Erik’s website reads.
|
||
|
||
Larson says he did a lot of the “tech work” on the project so that Erik could concentrate on content. The site was created with [Omeka][6], an open source web publishing platform for sharing digital collections and creating media-rich online exhibits, and [Curatescape][7], a framework for the open source Omeka CMS.
|
||
|
||
Larson explains that a key feature of TimelineJS is that it uses Google Sheets to store and organize the data used in the timeline. "Google Sheets is a good structure for organizing data simply, and that data will be available even if TimelineJS becomes unavailable in the future."
|
||
|
||
Larson says that he prefers using [ArcGIS][8] over KnightLab’s StoryMap because it uses spreadsheets to store content, whereas [StoryMap][9] does not. Larson is looking forward to integrating augmented reality into his projects in the future.
|
||
|
||
### Create your own open source timeline
|
||
|
||
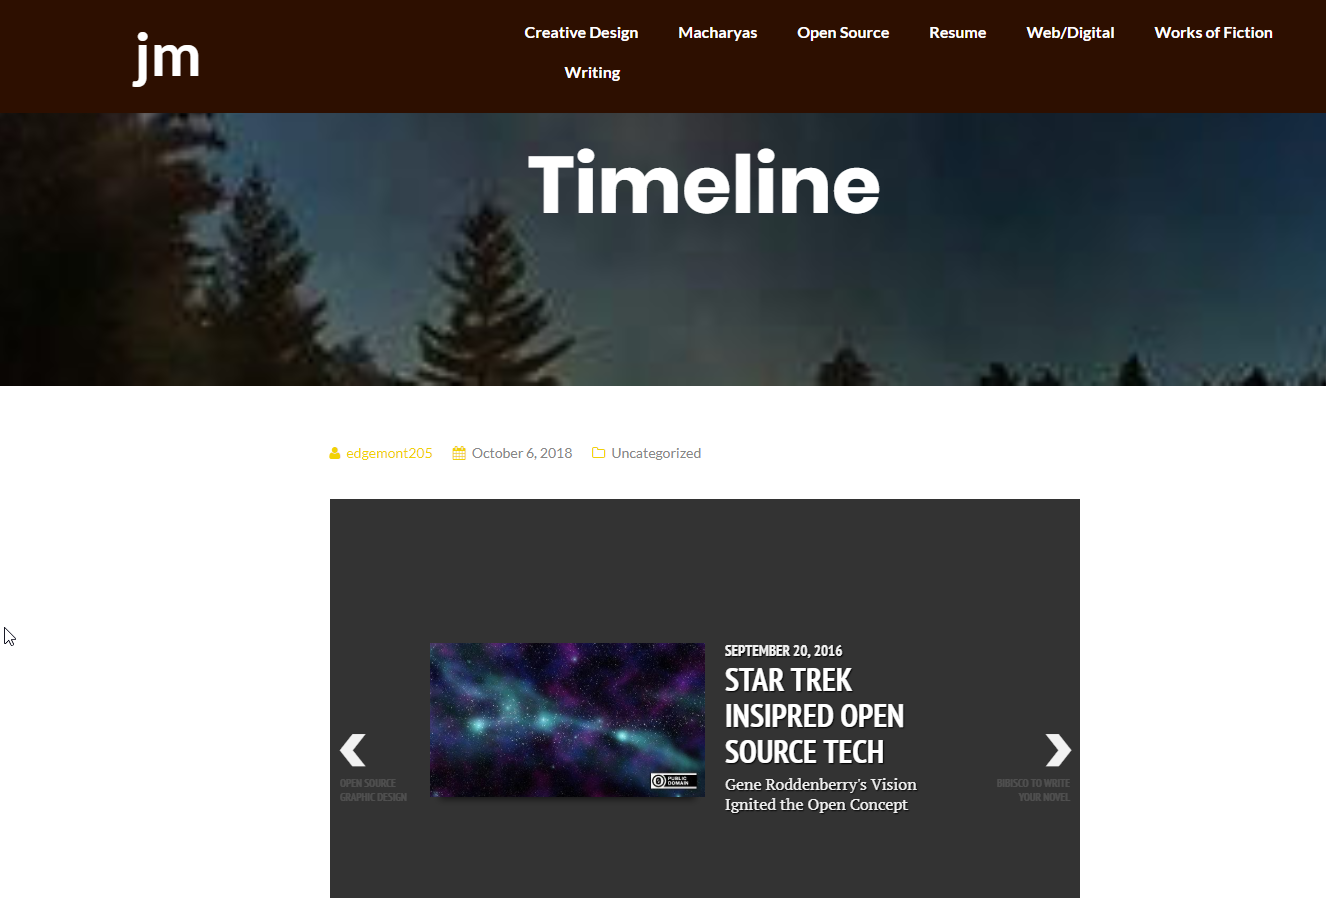
I plan on using TimelineJS to create interactive content for the Development and Alumni Relations department at Clarkson University, where I am the development communications specialist. To practice with working with it, I created [a simple timeline][10] of the articles I’ve written for [Opensource.com][11]:
|
||
|
||

|
||

|
||
|
||

|
||
|
||
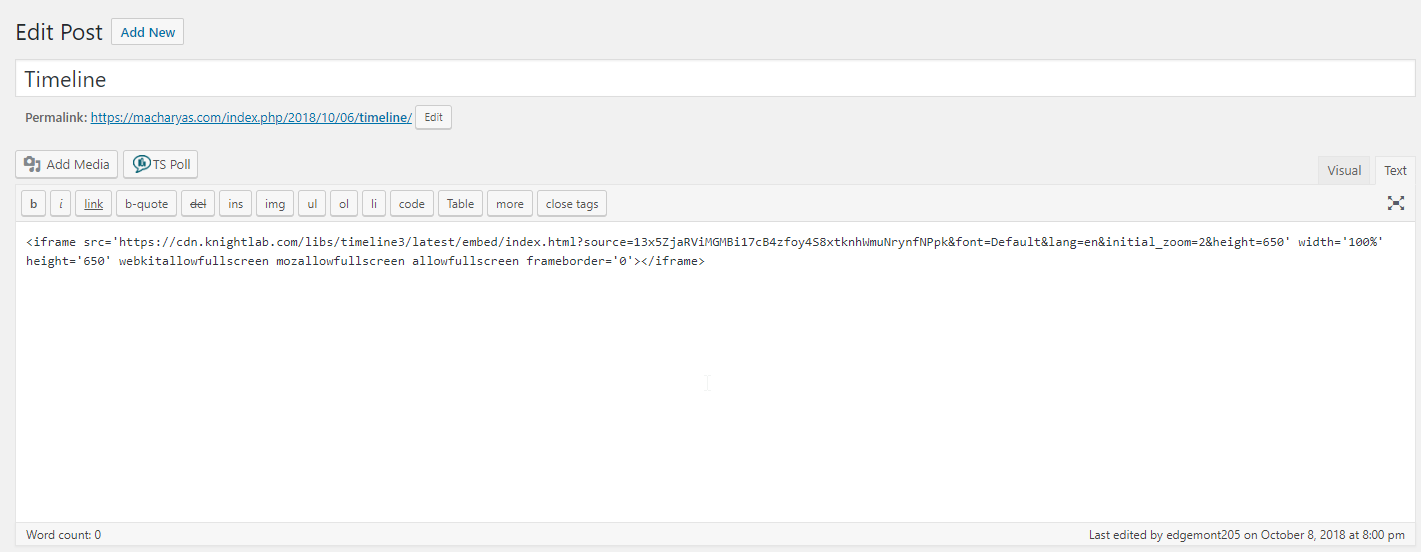
As Reid Larson stated, it is very easy to use and the results are quite satisfactory. I was able to get a working timeline created and posted to my WordPress site in a matter of minutes. I used media that I had already uploaded to my Media Library in WordPress and simply copied the image address. I typed in the dates, locations, and information in the other cells and used “publish to web” under “file” in the Google spreadsheet. That produced a link and embed code. I created a new post in my WordPress site and pasted in the embed code, and the timeline was live and working.
|
||
|
||
Of course, there is more customization I need to do, but I was able to get it working quickly and easily, much as Reid said it would.
|
||
|
||
I will continue experimenting with TimelineJS on my own site, and when I get more comfortable with it, I’ll use it for my professional projects and try out the other apps that KnightLab has created for interactive, visually appealing storytelling.
|
||
|
||
What might you use TimelineJS for?
|
||
|
||
--------------------------------------------------------------------------------
|
||
|
||
via: https://opensource.com/article/18/10/create-interactive-timelines-open-source-tool
|
||
|
||
作者:[Jeff Macharyas][a]
|
||
选题:[lujun9972][b]
|
||
译者:[译者ID](https://github.com/译者ID)
|
||
校对:[校对者ID](https://github.com/校对者ID)
|
||
|
||
本文由 [LCTT](https://github.com/LCTT/TranslateProject) 原创编译,[Linux中国](https://linux.cn/) 荣誉推出
|
||
|
||
[a]: https://opensource.com/users/rikki-endsley
|
||
[b]: https://github.com/lujun9972
|
||
[1]: https://timeline.knightlab.com/
|
||
[2]: https://timeline.knightlab.com/docs/json-format.html
|
||
[3]: https://vimeo.com/knightlab/timelinejs
|
||
[4]: https://github.com/NUKnightLab/TimelineJS3
|
||
[5]: http://nysplaces.com/
|
||
[6]: https://github.com/omeka
|
||
[7]: https://github.com/CPHDH/Curatescape
|
||
[8]: https://www.arcgis.com/index.html
|
||
[9]: https://storymap.knightlab.com/
|
||
[10]: https://macharyas.com/index.php/2018/10/06/timeline/
|
||
[11]: http://opensource.com/
|