22 KiB
An introduction to monitoring with Prometheus
Prometheus is a popular and powerful toolkit to monitor Kubernetes. This
is a tutorial on how to get started.

Metrics are the primary way to represent both the overall health of your system and any other specific information you consider important for monitoring and alerting or observability. Prometheus is a leading open source metric instrumentation, collection, and storage toolkit built at SoundCloud beginning in 2012. Since then, it's graduated from the Cloud Native Computing Foundation and become the de facto standard for Kubernetes monitoring. It has been covered in some detail in:
- Getting started with Prometheus
- 5 examples of Prometheus monitoring success
- Achieve high-scale application monitoring with Prometheus
- Tracking the weather with Python and Prometheus
However, none of these articles focus on how to use Prometheus on Kubernetes. This article:
- Describes the Prometheus architecture and data model to help you understand how it works and what it can do
- Provides a tutorial on setting Prometheus up in a Kubernetes cluster and using it to monitor clusters and applications
Architecture
While knowing how Prometheus works may not be essential to using it effectively, it can be helpful, especially if you're considering using it for production. The Prometheus documentation provides this graphic and details about the essential elements of Prometheus and how the pieces connect together.
For most use cases, you should understand three major components of Prometheus:
- The Prometheus server scrapes and stores metrics. Note that it uses a persistence layer, which is part of the server and not expressly mentioned in the documentation. Each node of the server is autonomous and does not rely on distributed storage. I'll revisit this later when looking to use a dedicated time-series database to store Prometheus data, rather than relying on the server itself.
- The web UI allows you to access, visualize, and chart the stored data. Prometheus provides its own UI, but you can also configure other visualization tools, like Grafana, to access the Prometheus server using PromQL (the Prometheus Query Language).
- Alertmanager sends alerts from client applications, especially the Prometheus server. It has advanced features for deduplicating, grouping, and routing alerts and can route through other services like PagerDuty and OpsGenie.
The key to understanding Prometheus is that it fundamentally relies on scraping, or pulling, metrics from defined endpoints. This means that your application needs to expose an endpoint where metrics are available and instruct the Prometheus server how to scrape it (this is covered in the tutorial below). There are exporters for many applications that do not have an easy way to add web endpoints, such as Kafka and Cassandra (using the JMX exporter).
Data model
Now that you understand how Prometheus works to scrape and store metrics, the next thing to learn is the kinds of metrics Prometheus supports. Some of the following information (noted with quotation marks) comes from the metric types section of the Prometheus documentation.
Counters and gauges
The two simplest metric types are counter and gauge. When getting started with Prometheus (or with time-series monitoring more generally), these are the easiest types to understand because it's easy to connect them to values you can imagine monitoring, like how much system resources your application is using or how many events it has processed.
"A counter is a cumulative metric that represents a single monotonically increasing counter whose value can only increase or be reset to zero on restart. For example, you can use a counter to represent the number of requests served, tasks completed, or errors."
Because you cannot decrease a counter, it can and should be used only to represent cumulative metrics.
"A gauge is a metric that represents a single numerical value that can arbitrarily go up and down. Gauges are typically used for measured values like [CPU] or current memory usage, but also 'counts' that can go up and down, like the number of concurrent requests."
Histograms and summaries
Prometheus supports two more complex metric types: histograms and summaries. There is ample opportunity for confusion here, given that they both track the number of observations and the sum of observed values. One of the reasons you might choose to use them is that you need to calculate an average of the observed values. Note that they create multiple time series in the database; for example, they each create a sum of the observed values with a _sum suffix.
"A histogram samples observations (usually things like request durations or response sizes) and counts them in configurable buckets. It also provides a sum of all observed values."
This makes it an excellent candidate to track things like latency that might have a service level objective (SLO) defined against it. From the documentation:
You might have an SLO to serve 95% of requests within 300ms. In that case, configure a histogram to have a bucket with an upper limit of 0.3 seconds. You can then directly express the relative amount of requests served within 300ms and easily alert if the value drops below 0.95. The following expression calculates it by job for the requests served in the last 5 minutes. The request durations were collected with a histogram called http_request_duration_seconds.
[code]
sum(rate(http_request_duration_seconds_bucket{le="0.3"}[5m])) by (job) / sum(rate(http_request_duration_seconds_count[5m])) by (job)
>
>

Returning to definitions:

> "Similar to a histogram, a **summary** samples observations (usually things like request durations and response sizes). While it also provides a total count of observations and a sum of all observed values, it calculates configurable quantiles over a sliding time window."

The essential difference between summaries and histograms is that summaries calculate streaming φ-quantiles on the client-side and expose them directly, while histograms expose bucketed observation counts, and the calculation of quantiles from the buckets of a histogram happens on the server-side using the **histogram_quantile()** function.

If you are still confused, I suggest taking the following approach:

  * Use gauges most of the time for straightforward time-series metrics.
  * Use counters for things you know to increase monotonically, e.g., if you are counting the number of times something happens.
  * Use histograms for latency measurements with simple buckets, e.g., one bucket for "under SLO" and another for "over SLO."


This should be sufficient for the overwhelming majority of use cases, and you should rely on a statistical analysis expert to help you with more advanced scenarios.

Now that you have a basic understanding of what Prometheus is, how it works, and the kinds of data it can collect and store, you're ready to begin the tutorial.

## Prometheus and Kubernetes hands-on tutorial

This tutorial covers the following:

  * Installing Prometheus in your cluster
  * Downloading the sample application and reviewing the code
  * Building and deploying the app and generating load against it
  * Accessing the Prometheus UI and reviewing the basic metrics


This tutorial assumes:

  * You already have a Kubernetes cluster deployed.
  * You have configured the **kubectl** command-line utility for access.
  * You have the **cluster-admin** role (or at least sufficient privileges to create namespaces and deploy applications).
  * You are running a Bash-based command-line interface. Adjust this tutorial if you run other operating systems or shell environments.


If you don't have Kubernetes running yet, this [Minikube tutorial][18] is an easy way to set it up on your laptop.

If you're ready now, let's go.

### Install Prometheus

In this section, you will clone the sample repository and use Kubernetes' configuration files to deploy Prometheus to a dedicated namespace.

  1. Clone the sample repository locally and use it as your working directory: [code] $ git clone <https://github.com/yuriatgoogle/prometheus-demo.git>
$ cd  prometheus-demo
$ WORKDIR=$(pwd)
- Create a dedicated namespace for the Prometheus deployment: [code]
$ kubectl create namespace prometheus
  3. Give your namespace the cluster reader role: [code] $ kubectl apply -f $WORKDIR/kubernetes/clusterRole.yaml
clusterrole.rbac.authorization.k8s.io/prometheus created
clusterrolebinding.rbac.authorization.k8s.io/prometheus created
- Create a Kubernetes configmap with scraping and alerting rules: [code] $ kubectl apply -f $WORKDIR/kubernetes/configMap.yaml -n prometheus configmap/prometheus-server-conf created
  5. Deploy Prometheus: [code] $ kubectl create -f prometheus-deployment.yaml -n prometheus
deployment.extensions/prometheus-deployment created
- Validate that Prometheus is running: [code] $ kubectl get pods -n prometheus NAME READY STATUS RESTARTS AGE prometheus-deployment-78fb5694b4-lmz4r 1/1 Running 0 15s
### Review basic metrics

In this section, you'll access the Prometheus UI and review the metrics being collected.

  1. Use port forwarding to enable web access to the Prometheus UI locally:
**Note:** Your **prometheus-deployment** will have a different name than this example. Review and replace the name of the pod from the output of the previous command. [code] $ kubectl port-forward prometheus-deployment-7ddb99dcb-fkz4d 8080:9090 -n prometheus
Forwarding from 127.0.0.1:8080 -> 9090
Forwarding from [::1]:8080 -> 9090
- Go to http://localhost:8080 in a browser:
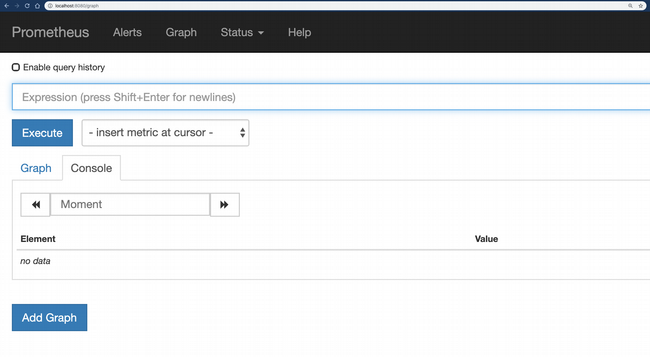
You are now ready to query Prometheus metrics!
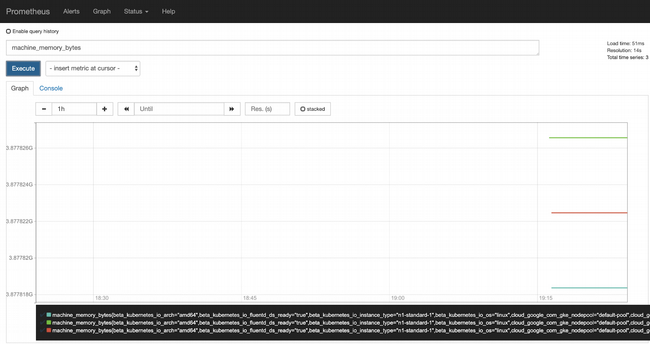
- Some basic machine metrics (like the number of CPU cores and memory) are available right away. For example, enter machine_memory_bytes in the expression field, switch to the Graph view, and click Execute to see the metric charted:
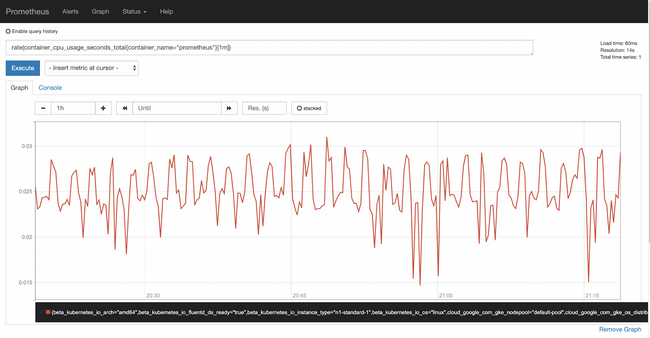
- Containers running in the cluster are also automatically monitored. For example, enter rate(container_cpu_usage_seconds_total{container_name="prometheus"}[1m]) as the expression and click Execute to see the rate of CPU usage by Prometheus:
Now that you know how to install Prometheus and use it to measure some out-of-the-box metrics, it's time for some real monitoring.
Golden signals
As described in the "Monitoring Distributed Systems" chapter of Google's SRE book:
"The four golden signals of monitoring are latency, traffic, errors, and saturation. If you can only measure four metrics of your user-facing system, focus on these four."
The book offers thorough descriptions of all four, but this tutorial focuses on the three signals that most easily serve as proxies for user happiness:
- Traffic: How many requests you're receiving
- Error rate: How many of those requests you can successfully serve
- Latency: How quickly you can serve successful requests
As you probably realize by now, Prometheus does not measure any of these for you; you'll have to instrument any application you deploy to emit them. Following is an example implementation.
Open the $WORKDIR/node/golden_signals/app.js file, which is a sample application written in Node.js (recall we cloned yuriatgoogle/prometheus-demo and exported $WORKDIR earlier). Start by reviewing the first section, where the metrics to be recorded are defined:
// total requests - counter
const nodeRequestsCounter = new prometheus.Counter({
    name: 'node_requests',
    help: 'total requests'
});
The first metric is a counter that will be incremented for each request; this is how the total number of requests is counted:
// failed requests - counter
const nodeFailedRequestsCounter = new prometheus.Counter({
    name: 'node_failed_requests',
    help: 'failed requests'
});
The second metric is another counter that increments for each error to track the number of failed requests:
// latency - histogram
const nodeLatenciesHistogram = new prometheus.Histogram({
    name: 'node_request_latency',
    help: 'request latency by path',
    labelNames: ['route'],
    buckets: [100, 400]
});
The third metric is a histogram that tracks request latency. Working with a very basic assumption that the SLO for latency is 100ms, you will create two buckets: one for 100ms and the other 400ms latency.
The next section handles incoming requests, increments the total requests metric for each one, increments failed requests when there is an (artificially induced) error, and records a latency histogram value for each successful request. I have chosen not to record latencies for errors; that implementation detail is up to you.
app.get('/', (req, res) => {
    // start latency timer
    const requestReceived = new Date().getTime();
    console.log('request made');
    // increment total requests counter
    nodeRequestsCounter.inc();
    // return an error 1% of the time
    if ((Math.floor(Math.random() * 100)) == 100) {
        // increment error counter
        nodeFailedRequestsCounter.inc();
        // return error code
        res.send("error!", 500);
    }
    else {
        // delay for a bit
        sleep.msleep((Math.floor(Math.random() * 1000)));
        // record response latency
        const responseLatency = new Date().getTime() - requestReceived;
        nodeLatenciesHistogram
            .labels(req.route.path)
            .observe(responseLatency);
        res.send("success in " + responseLatency + " ms");
    }
})
Test locally
Now that you've seen how to implement Prometheus metrics, see what happens when you run the application.
- Install the required packages: [code] $ cd $WORKDIR/node/golden_signals $ npm install --save
2. Launch the app: [code]`$ node app.js`
- Open two browser tabs: one to http://localhost:8080 and another to http://localhost:8080/metrics.
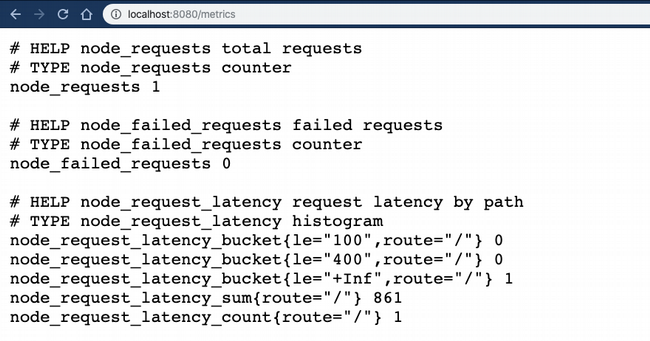
- When you go to the /metrics page, you can see the Prometheus metrics being collected and updated every time you reload the home page:
You're now ready to deploy the sample application to your Kubernetes cluster and test your monitoring.
Deploy monitoring to Prometheus on Kubernetes
Now it's time to see how metrics are recorded and represented in the Prometheus instance deployed in your cluster by:
- Building the application image
- Deploying it to your cluster
- Generating load against the app
- Observing the metrics recorded
Build the application image
The sample application provides a Dockerfile you'll use to build the image. This section assumes that you have:
- Docker installed and configured locally
- A Docker Hub account
- Created a repository
If you're using Google Kubernetes Engine to run your cluster, you can use Cloud Build and the Google Container Registry instead.
- Switch to the application directory: [code]
$ cd $WORKDIR/node/golden_signals
2. Build the image with this command: [code]`$ docker build . --tag=<Docker username>/prometheus-demo-node:latest`
- Make sure you're logged in to Docker Hub: [code]
$ docker login
4. Push the image to Docker Hub using this command: [code]`$ docker push <username>/prometheus-demo-node:latest`
- Verify that the image is available: [code]
$ docker images
#### Deploy the application

Now that the application image is in the Docker Hub, you can deploy it to your cluster and run the application.

  1. Modify the **$WORKDIR/node/golden_signals/prometheus-demo-node.yaml** file to pull the image from Docker Hub: [code] spec:
      containers:
      - image: docker.io/<Docker username>/prometheus-demo-node:latest
- Deploy the image: [code] $ kubectl apply -f $WORKDIR/node/golden_signals/prometheus-demo-node.yaml deployment.extensions/prometheus-demo-node created
  3. Verify that the application is running: [code] $ kubectl get pods
NAME                                    READY   STATUS    RESTARTS   AGE
prometheus-demo-node-69688456d4-krqqr   1/1     Running   0          65s
- Expose the application using a load balancer: [code] $ kubectl expose deployment prometheus-node-demo --type=LoadBalancer --name=prometheus-node-demo --port=8080 service/prometheus-demo-node exposed
  5. Confirm that your service has an external IP address: [code] $ kubectl get services
NAME                   TYPE           CLUSTER-IP      EXTERNAL-IP      PORT(S)          AGE
kubernetes             ClusterIP      10.39.240.1     <none>           443/TCP          23h
prometheus-demo-node   LoadBalancer   10.39.248.129   35.199.186.110   8080:31743/TCP   78m
Generate load to test monitoring
Now that your service is up and running, generate some load against it by using Apache Bench.
- Get the IP address of your service as a variable: [code]
$ export SERVICE_IP=$(kubectl get svc prometheus-demo-node -ojson | jq -r '.status.loadBalancer.ingress[].ip')
2. Use **ab** to generate some load. You may want to run this in a separate terminal window. [code]`$ ab -c 3 -n 1000 http://${SERVICE_IP}:8080/`
Review metrics
While the load is running, access the Prometheus UI in the cluster again and confirm that the "golden signal" metrics are being collected.
- Establish a connection to Prometheus: [code]
$ kubectl get pods -n prometheus NAME READY STATUS RESTARTS AGE prometheus-deployment-78fb5694b4-lmz4r 1/1 Running 0 15s
$ kubectl port-forward prometheus-deployment-78fb5694b4-lmz4r 8080:9090 -n prometheus Forwarding from 127.0.0.1:8080 -> 9090 Forwarding from [::1]:8080 -> 9090
**Note:** Make sure to replace the name of the pod in the second command with the output of the first.

  2. Open <http://localhost:8080> in a browser:


![Prometheus console][26]

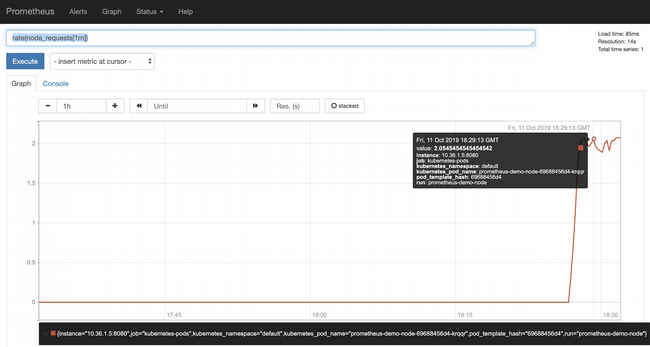
  3. Use this expression to measure the request rate: [code]`rate(node_requests[1m])`
- Use this expression to measure your error rate: [code]
rate(node_failed_requests[1m])
![Measuring the error rate][28]

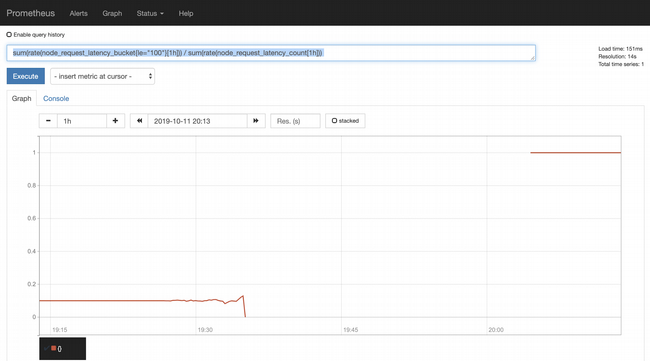
  5. Finally, use this expression to validate your latency SLO. Remember that you set up two buckets, 100ms and 400ms. This expression returns the percentage of requests that meet the SLO : [code]`sum(rate(node_request_latency_bucket{le="100"}[1h])) / sum(rate(node_request_latency_count[1h]))`
About 10% of the requests are within SLO. This is what you should expect since the code sleeps for a random number of milliseconds between 0 and 1,000. As such, about 10% of the time, it returns in more than 100ms, and this graph shows that you can't meet the latency SLO as a result.
Summary
Congratulations! You've completed the tutorial and hopefully have a much better understanding of how Prometheus works, how to instrument your application with custom metrics, and how to use it to measure your SLO compliance. The next article in this series will look at another metric instrumentation approach using OpenCensus.
via: https://opensource.com/article/19/11/introduction-monitoring-prometheus
作者:Yuri Grinshteyn 选题:lujun9972 译者:译者ID 校对:校对者ID

