21 KiB
A distributed database load-balancing architecture with ShardingSphere
Apache ShardingSphere is a distributed database ecosystem that transforms any database into a distributed database and enhances it with data sharding, elastic scaling, encryption, and other capabilities. In this article, I demonstrate how to build a distributed database load-balancing architecture based on ShardingSphere and the impact of introducing load balancing.
The architecture
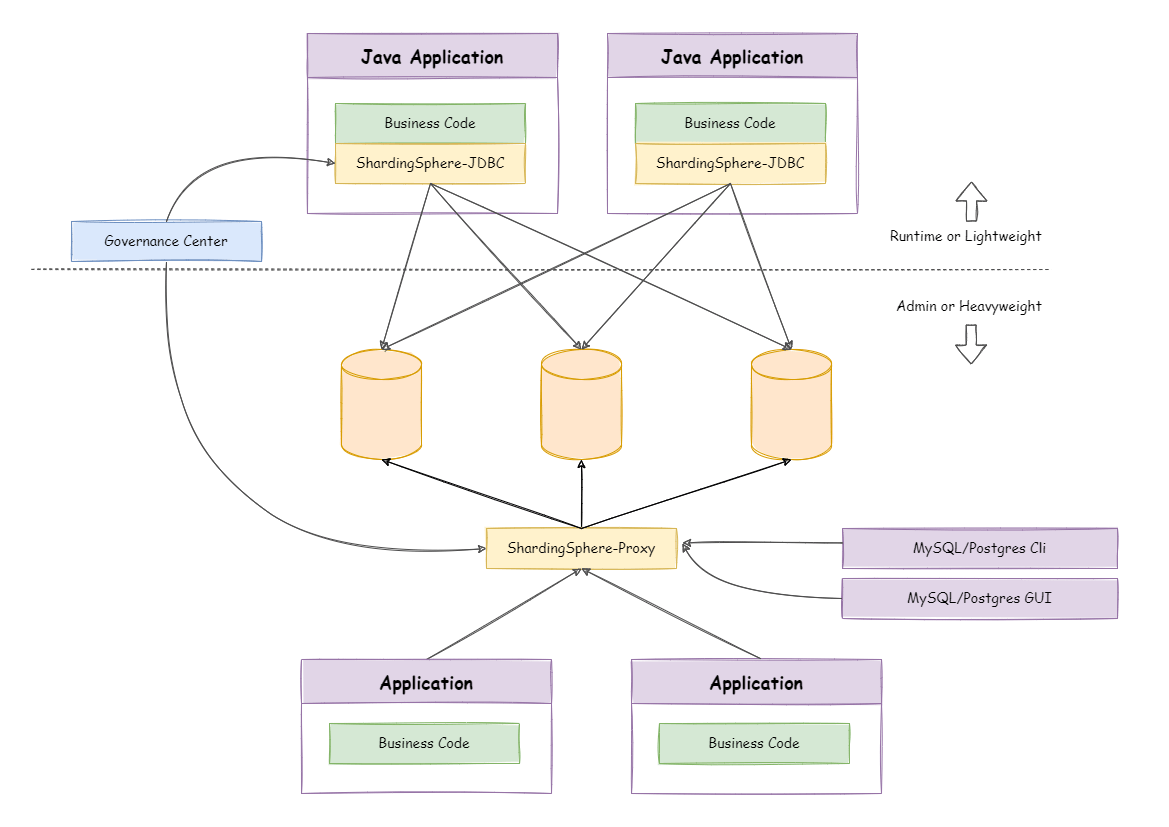
A ShardingSphere distributed database load-balancing architecture consists of two products: ShardingSphere-JDBC and ShardingSphere-Proxy, which can be deployed independently or in a hybrid architecture. The following is the hybrid deployment architecture:
ShardingSphere-JDBC load-balancing solution
ShardingSphere-JDBC is a lightweight Java framework with additional services in the JDBC layer. ShardingSphere-JDBC adds computational operations before the application performs database operations. The application process still connects directly to the database through the database driver.
As a result, users don't have to worry about load balancing with ShardingSphere-JDBC. Instead, they can focus on how their application is load balanced.
ShardingSphere-Proxy load-balancing solution
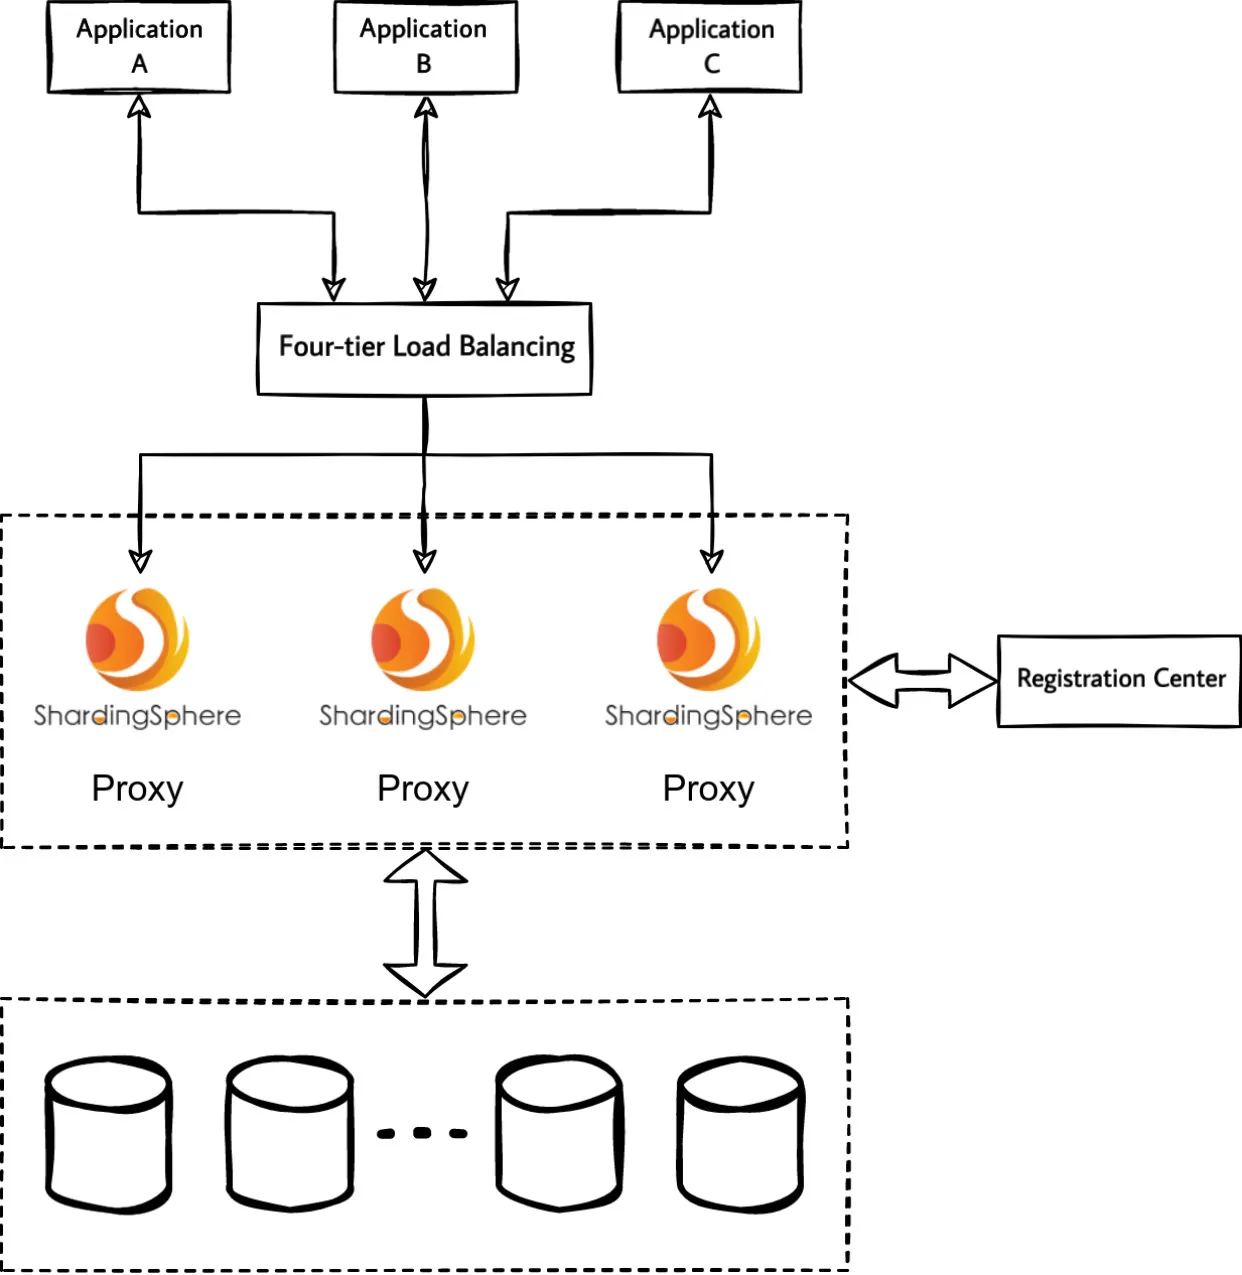
ShardingSphere-Proxy is a transparent database proxy that provides services to clients over the database protocol. Here's ShardingSphere-Proxy as a standalone deployed process with load balancing on top of it:
Load balancing solution essentials
The key point of ShardingSphere-Proxy cluster load balancing is that the database protocol itself is designed to be stateful (connection authentication status, transaction status, Prepared Statement, and so on).
If the load balancing on top of the ShardingSphere-Proxy cannot understand the database protocol, your only option is to select a four-tier load balancing proxy ShardingSphere-Proxy cluster. In this case, a specific proxy instance maintains the state of the database connection between the client and ShardingSphere-Proxy.
Because the proxy instance maintains the connection state, four-tier load balancing can only achieve connection-level load balancing. Multiple requests for the same database connection cannot be polled to multiple proxy instances. Request-level load balancing is not possible.
This article does not cover the details of four- and seven-tier load balancing.
Recommendations for the application layer
Theoretically, there is no functional difference between a client connecting directly to a single ShardingSphere-Proxy or a ShardingSphere-Proxy cluster through a load-balancing portal. However, there are some differences in the technical implementation and configuration of the different load balancers.
For example, in the case of a direct connection to ShardingSphere-Proxy with no limit on the total time a database connection session can be held, some Elastic Load Balancing (ELB) products have a maximum session hold time of 60 minutes at Layer 4. If an idle database connection is closed by a load balancing timeout, but the client is not aware of the passive TCP connection closure, the application may report an error.
Therefore, in addition to considerations at the load balancing level, you might consider measures for the client to avoid the impact of introducing load balancing.
On-demand connection creation
If a connection's instance is created and used continuously, the database connection will be idle most of the time when executing a timed job with a one-hour interval and a short execution time. When a client itself is unaware of changes in the connection state, the long idle time increases the uncertainty of the connection state. For scenarios with long execution intervals, consider creating connections on demand and releasing them after use.
Connection pooling
General database connection pools have the ability to maintain valid connections, reject failed connections, and so on. Managing database connections through connection pools can reduce the cost of maintaining connections yourself.
Enable TCP KeepAlive
Clients generally support TCP KeepAlive configuration:
- MySQL Connector/J supports
autoReconnectortcpKeepAlive, which are not enabled by default. - The PostgreSQL JDBC Driver supports
tcpKeepAlive, which is not enabled by default.
Nevertheless, there are some limitations to how TCP KeepAlive can be enabled:
- The client does not necessarily support the configuration of TCP
KeepAliveor automatic reconnection. - The client does not intend to make any code or configuration adjustments.
- TCP
KeepAliveis dependent on the operating system implementation and configuration.
User case
Recently, a ShardingSphere community member provided feedback that their ShardingSphere-Proxy cluster was providing services to the public with upper-layer load balancing. In the process, they found problems with the connection stability between their application and ShardingSphere-Proxy.
Problem description
Assume the user's production environment uses a three-node ShardingSphere-Proxy cluster serving applications through a cloud vendor's ELB.
One of the applications is a resident process that executes timed jobs, which are executed hourly and have database operations in the job logic. The user feedback is that each time a timed job is triggered, an error is reported in the application log:
send of 115 bytes failed with errno=104 Connection reset by peer
Checking the ShardingSphere-Proxy logs, there are no abnormal messages.
The issue only occurs with timed jobs that execute hourly. All other applications access ShardingSphere-Proxy normally. As the job logic has a retry mechanism, the job executes successfully after each retry without impacting the original business.
Problem analysis
The reason why the application shows an error is clear—the client is sending data to a closed TCP connection. The troubleshooting goal is to identify exactly why the TCP connection was closed.
If you encounter any of the three reasons listed below, I recommend that you perform a network packet capture on both the application and the ShardingSphere-Proxy side within a few minutes before and after the point at which the problem occurs:
- The problem will recur on an hourly basis.
- The issue is network related.
- The issue does not affect the user's real-time operations.
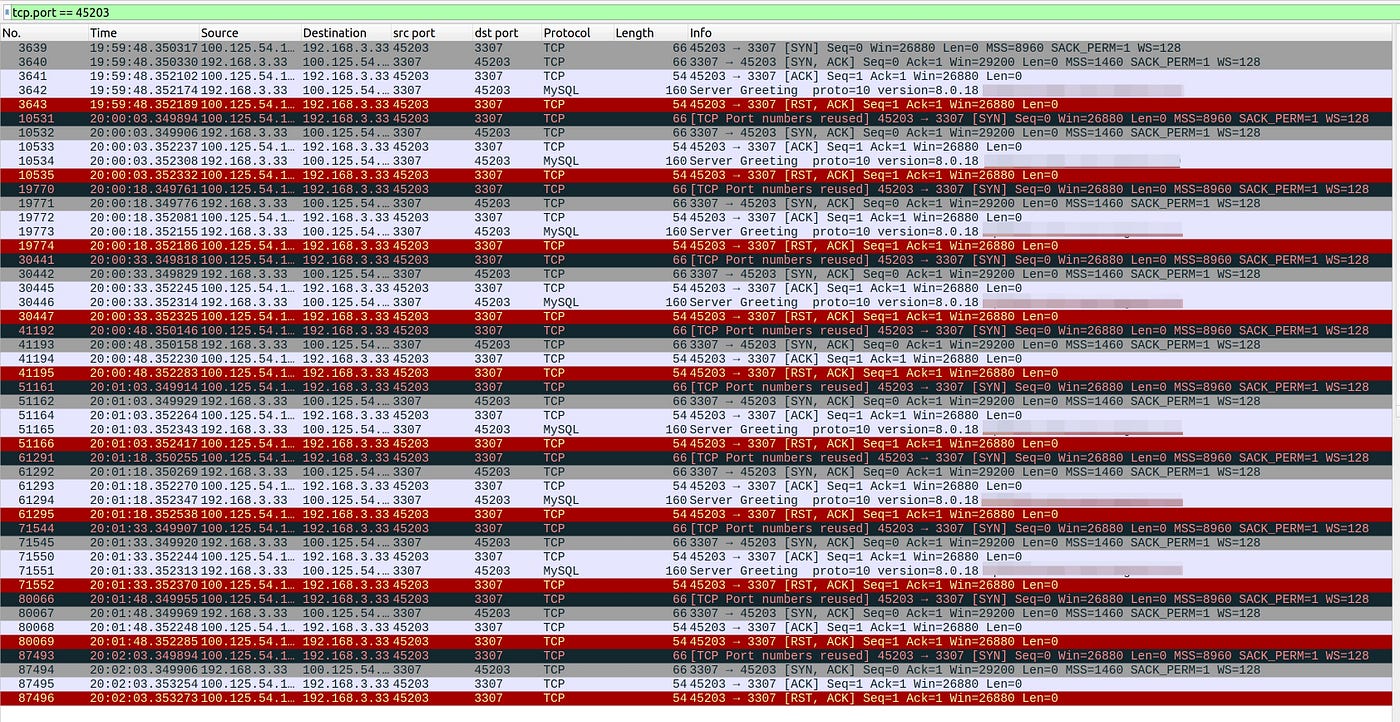
Packet capture phenomenon 1
ShardingSphere-Proxy receives a TCP connection establishment request from the client every 15 seconds. The client, however, sends an RST to the proxy immediately after establishing the connection with three handshakes. The client sends an RST to the proxy without any response after receiving the Server Greeting or even before the proxy has sent the Server Greeting.
However, no traffic matching the above behavior exists in the application-side packet capture results.
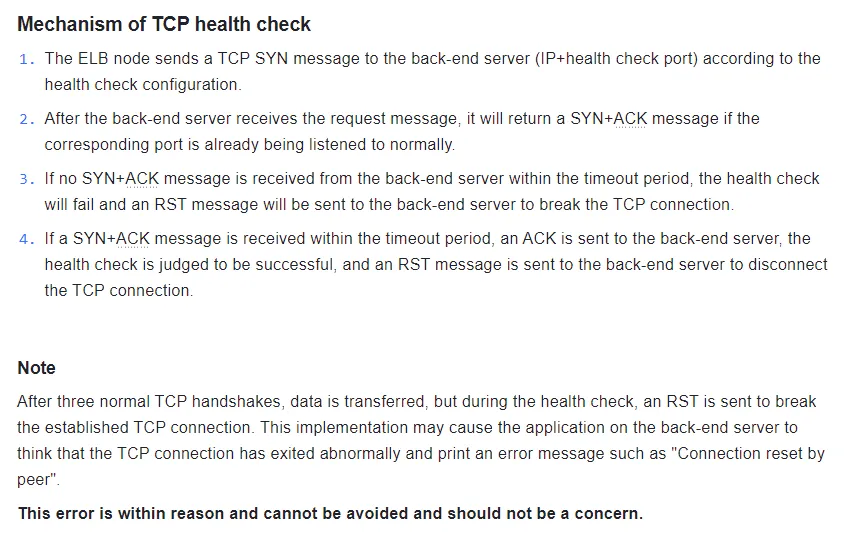
By consulting the community member's ELB documentation, I found that the above network interaction is how that ELB implements the four-layer health check mechanism. Therefore, this phenomenon is not relevant to the problem in this case.
Packet capture phenomenon 2
The MySQL connection is established between the client and the ShardingSphere-Proxy, and the client sends an RST to the proxy during the TCP connection disconnection phase.
The above packet capture results reveal that the client first initiated the COM_QUIT command to ShardingSphere-Proxy. The client disconnected the MySQL connection based on but not limited to the following possible scenarios:
- The application finished using the MySQL connection and closed the database connection normally.
- The application's database connection to ShardingSphere-Proxy is managed by a connection pool, which performs a release operation for idle connections that have timed out or have exceeded their maximum lifetime. As the connection is actively closed on the application side, it does not theoretically affect other business operations unless there is a problem with the application's logic.
After several rounds of packet analysis, no RSTs had been sent to the client by the ShardingSphere-Proxy in the minutes before and after the problem surfaced.
Based on the available information, it's possible that the connection between the client and ShardingSphere-Proxy was disconnected earlier, but the packet capture time was limited and did not capture the moment of disconnection.
Because the ShardingSphere-Proxy itself does not have the logic to actively disconnect the client, the problem is being investigated at both the client and ELB levels.
Client application and ELB configuration check
The user feedback included the following additional information:
- The application's timed jobs execute hourly, the application does not use a database connection pool, and a database connection is manually maintained and provided for ongoing use by the timed jobs.
- The ELB is configured with four levels of session hold and a session idle timeout of 40 minutes.
Considering the frequency of execution of timed jobs, I recommend that users modify the ELB session idle timeout to be greater than the execution interval of timed jobs. After the user changed the ELB timeout to 66 minutes, the connection reset problem no longer occurred.
If the user had continued packet capturing during troubleshooting, it's likely they would have found ELB traffic that disconnects the TCP connection at the 40th minute of each hour.
Problem conclusion
The client reported an error Connection reset by peer Root cause.
The ELB idle timeout was less than the timed task execution interval. The client was idle for longer than the ELB session hold timeout, resulting in the connection between the client and ShardingSphere-Proxy being disconnected by the ELB timeout.
The client sent data to a TCP connection that had been closed by the ELB, resulting in the error Connection reset by peer.
Timeout simulation experiment
I decided to conduct a simple experiment to verify the client's performance after a load-balancing session timeout. I performed a packet capture during the experiment to analyze network traffic and observe the behavior of load-balancing.
Build a load-balanced ShardingSphere-Proxy clustered environment
Theoretically, this article could cover any four-tier load-balancing implementation. I selected Nginx.
I set the TCP session idle timeout to one minute, as seen below:
user  nginx;
worker_processes  auto;

error_log  /var/log/nginx/error.log notice;
pid        /var/run/nginx.pid;

events {
    worker_connections  1024;
}

stream {
    upstream shardingsphere {
        hash $remote_addr consistent;

        server proxy0:3307;
        server proxy1:3307;
    }

    server {
        listen 3306;
        proxy_timeout 1m;
        proxy_pass shardingsphere;
    }
}
Construct a Docker compose file
Here's a Docker compose file:
version: "3.9"
services:

  nginx:
    image: nginx:1.22.0
    ports:
      - 3306:3306
    volumes:
      - /path/to/nginx.conf:/etc/nginx/nginx.conf

  proxy0:
    image: apache/shardingsphere-proxy:5.3.0
    hostname: proxy0
    ports:
      - 3307

  proxy1:
    image: apache/shardingsphere-proxy:5.3.0
    hostname: proxy1
    ports:
      - 3307
Startup environment
Start the containers:
$ docker compose up -d
[+] Running 4/4
 ⠿ Network lb_default     Created                                                                               0.0s
 ⠿ Container lb-proxy1-1  Started                                                                               0.5s
 ⠿ Container lb-proxy0-1  Started                                                                               0.6s
 ⠿ Container lb-nginx-1   Started
Simulation of client-side same-connection-based timed tasks
First, construct a client-side deferred SQL execution. Here, the ShardingSphere-Proxy is accessed through Java and MySQL Connector/J.
The logic:
- Establish a connection to the ShardingSphere-Proxy and execute a query to the proxy.
- Wait 55 seconds and then execute another query to the proxy.
- Wait 65 seconds and then execute another query to the proxy.
public static void main(String[] args) {
    try (Connection connection = DriverManager.getConnection("jdbc:mysql://127.0.0.1:3306?useSSL=false", "root", "root"); Statement statement = connection.createStatement()) {
        log.info(getProxyVersion(statement));
        TimeUnit.SECONDS.sleep(55);
        log.info(getProxyVersion(statement));
        TimeUnit.SECONDS.sleep(65);
        log.info(getProxyVersion(statement));
    } catch (Exception e) {
        log.error(e.getMessage(), e);
    }
}

private static String getProxyVersion(Statement statement) throws SQLException {
    try (ResultSet resultSet = statement.executeQuery("select version()")) {
        if (resultSet.next()) {
            return resultSet.getString(1);
        }
    }
    throw new UnsupportedOperationException();
}
Expected and client-side run results:
- A client connects to the ShardingSphere-Proxy, and the first query is successful.
- The client's second query is successful.
- The client's third query results in an error due to a broken TCP connection because the Nginx idle timeout is set to one minute.
The execution results are as expected. Due to differences between the programming language and the database driver, the error messages behave differently, but the underlying cause is the same: Both TCP connections have been disconnected.
The logs are shown below:
15:29:12.734 [main] INFO icu.wwj.hello.jdbc.ConnectToLBProxy - 5.7.22-ShardingSphere-Proxy 5.1.1
15:30:07.745 [main] INFO icu.wwj.hello.jdbc.ConnectToLBProxy - 5.7.22-ShardingSphere-Proxy 5.1.1
15:31:12.764 [main] ERROR icu.wwj.hello.jdbc.ConnectToLBProxy - Communications link failure
The last packet successfully received from the server was 65,016 milliseconds ago. The last packet sent successfully to the server was 65,024 milliseconds ago.
        at com.mysql.cj.jdbc.exceptions.SQLError.createCommunicationsException(SQLError.java:174)
        at com.mysql.cj.jdbc.exceptions.SQLExceptionsMapping.translateException(SQLExceptionsMapping.java:64)
        at com.mysql.cj.jdbc.StatementImpl.executeQuery(StatementImpl.java:1201)
        at icu.wwj.hello.jdbc.ConnectToLBProxy.getProxyVersion(ConnectToLBProxy.java:28)
        at icu.wwj.hello.jdbc.ConnectToLBProxy.main(ConnectToLBProxy.java:21)
Caused by: com.mysql.cj.exceptions.CJCommunicationsException: Communications link failure

The last packet successfully received from the server was 65,016 milliseconds ago. The last packet sent successfully to the server was 65,024 milliseconds ago.
        at java.base/jdk.internal.reflect.NativeConstructorAccessorImpl.newInstance0(Native Method)
        at java.base/jdk.internal.reflect.NativeConstructorAccessorImpl.newInstance(NativeConstructorAccessorImpl.java:77)
        at java.base/jdk.internal.reflect.DelegatingConstructorAccessorImpl.newInstance(DelegatingConstructorAccessorImpl.java:45)
        at java.base/java.lang.reflect.Constructor.newInstanceWithCaller(Constructor.java:499)
        at java.base/java.lang.reflect.Constructor.newInstance(Constructor.java:480)
        at com.mysql.cj.exceptions.ExceptionFactory.createException(ExceptionFactory.java:61)
        at com.mysql.cj.exceptions.ExceptionFactory.createException(ExceptionFactory.java:105)
        at com.mysql.cj.exceptions.ExceptionFactory.createException(ExceptionFactory.java:151)
        at com.mysql.cj.exceptions.ExceptionFactory.createCommunicationsException(ExceptionFactory.java:167)
        at com.mysql.cj.protocol.a.NativeProtocol.readMessage(NativeProtocol.java:581)
        at com.mysql.cj.protocol.a.NativeProtocol.checkErrorMessage(NativeProtocol.java:761)
        at com.mysql.cj.protocol.a.NativeProtocol.sendCommand(NativeProtocol.java:700)
        at com.mysql.cj.protocol.a.NativeProtocol.sendQueryPacket(NativeProtocol.java:1051)
        at com.mysql.cj.protocol.a.NativeProtocol.sendQueryString(NativeProtocol.java:997)
        at com.mysql.cj.NativeSession.execSQL(NativeSession.java:663)
        at com.mysql.cj.jdbc.StatementImpl.executeQuery(StatementImpl.java:1169)
        ... 2 common frames omitted
Caused by: java.io.EOFException: Can not read response from server. Expected to read 4 bytes, read 0 bytes before connection was unexpectedly lost.
        at com.mysql.cj.protocol.FullReadInputStream.readFully(FullReadInputStream.java:67)
        at com.mysql.cj.protocol.a.SimplePacketReader.readHeaderLocal(SimplePacketReader.java:81)
        at com.mysql.cj.protocol.a.SimplePacketReader.readHeader(SimplePacketReader.java:63)
        at com.mysql.cj.protocol.a.SimplePacketReader.readHeader(SimplePacketReader.java:45)
        at com.mysql.cj.protocol.a.TimeTrackingPacketReader.readHeader(TimeTrackingPacketReader.java:52)
        at com.mysql.cj.protocol.a.TimeTrackingPacketReader.readHeader(TimeTrackingPacketReader.java:41)
        at com.mysql.cj.protocol.a.MultiPacketReader.readHeader(MultiPacketReader.java:54)
        at com.mysql.cj.protocol.a.MultiPacketReader.readHeader(MultiPacketReader.java:44)
        at com.mysql.cj.protocol.a.NativeProtocol.readMessage(NativeProtocol.java:575)
        ... 8 common frames omitted
Packet capture results analysis
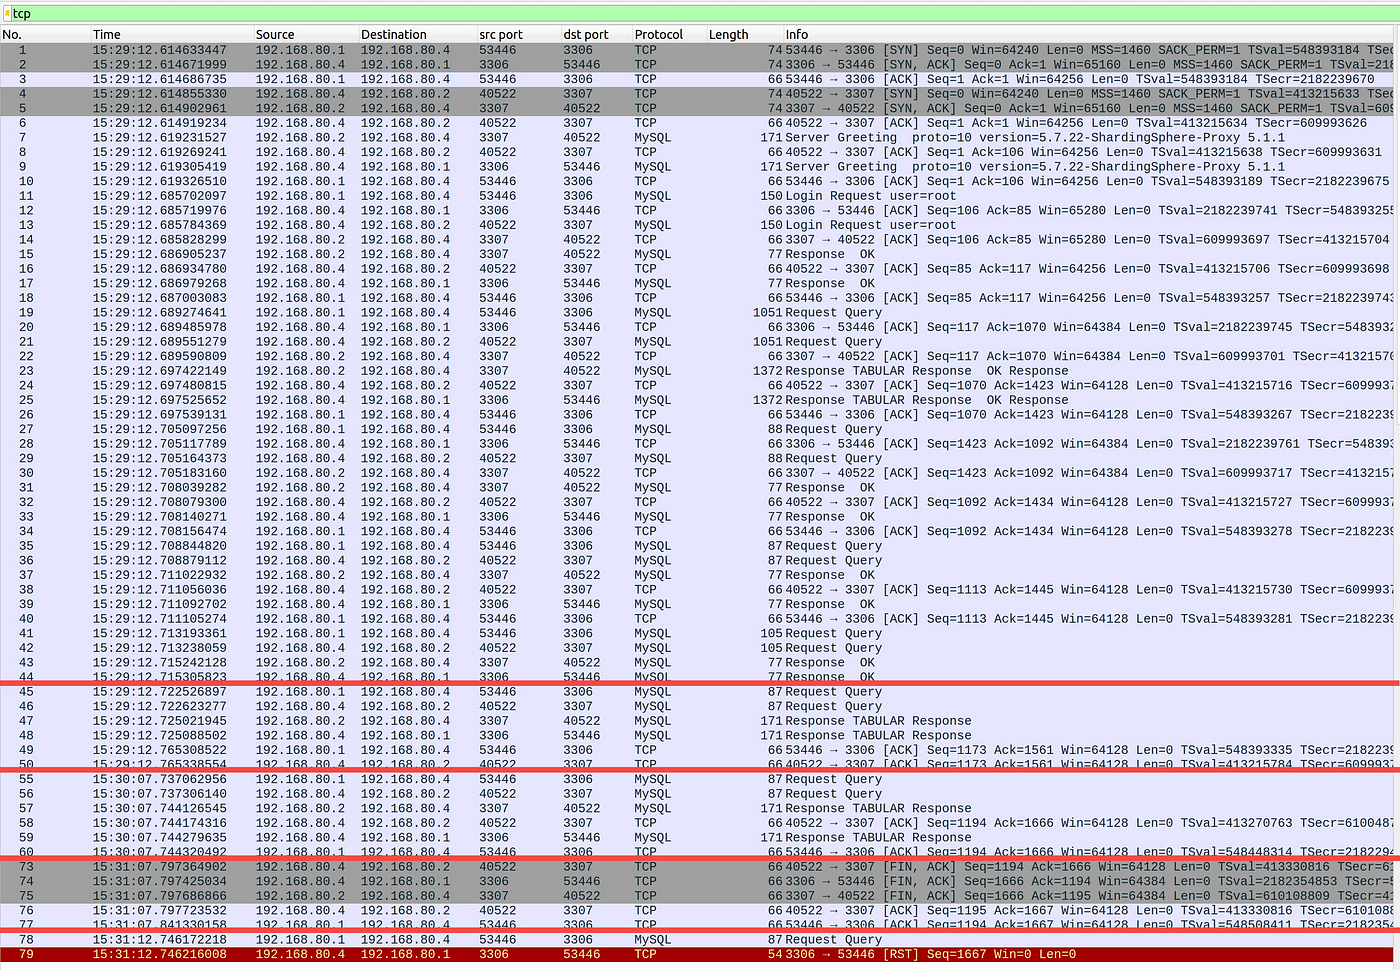
The packet capture results show that after the connection idle timeout, Nginx simultaneously disconnects from the client and the proxy over TCP. However, the client is not aware of this, so Nginx returns an RST after sending the command.
After the Nginx connection idle timeout, the TCP disconnection process with the proxy completes normally. The proxy is unaware when the client sends subsequent requests using the disconnected connection.
Analyze the following packet capture results:
- Numbers 1–44 are the interaction between the client and the ShardingSphere-Proxy to establish a MySQL connection.
- Numbers 45–50 are the first query performed by the client.
- Numbers 55–60 are the second query executed by the client 55 seconds after the first query is executed.
- Numbers 73–77 are the TCP connection disconnection processes initiated by Nginx to both the client and ShardingSphere-Proxy after the session times out.
- Numbers 78–79 are the third query executed 65 seconds after the client executes the second query, including the Connection Reset.
Wrap up
Troubleshooting disconnection issues involves examining both the ShardingSphere-Proxy settings and the configurations enforced by the cloud service provider's ELB. It's useful to capture packets to understand when particular events—especially DST messages—occur compared to idle time and timeout settings.
The above implementation and troubleshooting scenario is based on a specific ShardingSphere-Proxy deployment. For a discussion of cloud-based options, see my followup article. ShardingSphere on Cloud offers additional management options and configurations for a variety of cloud service provider environments.
This article is adapted from A Distributed Database Load Balancing Architecture Based on ShardingSphere: Demo and User Case and is republished with permission.
via: https://opensource.com/article/23/4/distributed-database-load-balancing-architecture-shardingsphere
