使用 Ganglia 对 linux 网格和集群服务器进行实时监控
===========
从系统管理员接手服务器和主机管理以来,像应用监控这样的工具就成了他们的好帮手。其中比较有名的有 [Nagios][11]、 [Zabbix][10]、 [Icinga][9] 和 Centreon。以上这些是重量级的监控工具,让一个新手管理员来设置,并使用其中的高级特性是有些困难的。
本文将向你介绍 Ganglia,它是一个易于扩展的监控系统。使用它可以实时查看 Linux 服务器和集群(图形化展示)中的各项性能指标。

*在 Linux 上安装 Ganglia*
**Ganglia** 能够让你以**集群**(按服务器组)和**网格**(按地理位置)的方式更好地组织服务器。
这样,我们可以创建一个包含所有远程主机的网格,然后将那些机器按照其它标准分组成小的集合。
此外, Ganglia 的 web 页面对移动设备进行过优化,也允许你导出 `csv` 和 `.json` 格式的数据。
我们的测试环境包括一个安装 Ganglia 的主节点服务器 CentOS 7 (IP 地址 192.168.0.29),和一个作为被监控端的 Ubuntu 14.04 主机(192.168.0.32)。我们将通过 Ganglia 的 Web 页面来监控这台 Ubuntu 主机。
下面的例子可以给大家提供参考,CentOS7 作为主节点,Ubuntu 作为被监控对象。
### 安装和配置 Ganglia
请遵循以下步骤,在主节点服务器安装监控工具。
1、 启用 [EPEL 仓库][7] ,然后安装 Ganglia 和相关工具:
```
# yum update && yum install epel-release
# yum install ganglia rrdtool ganglia-gmetad ganglia-gmond ganglia-web
```
在上面这步随 Ganglia 将安装一些应用,它们的功能如下:
- `rrdtool`,Round-Robin 数据库,它是一个储存并图形化显示随着时间变化的数据的工具;
- `ganglia-gmetad` 一个守护进程,用来收集被监控主机的数据。被监控主机与主节点主机都要安装 Ganglia-gmond(监控守护进程本身);
- `ganglia-web` 提供 Web 前端,用于显示监控系统的历史数据和图形。
2、 使用 Apache 提供的基本认证功能,为 Ganglia Web 界面(`/usr/share/ganglia`)配置身份认证。
如果你想了解更多高级安全机制,请参阅 Apache 文档的 [授权与认证][6]部分。
为完成这个目标,我们需要创建一个用户名并设定一个密码,以访问被 Apache 保护的资源。在本例中,我们先来创建一个叫 `adminganglia` 的用户名,然后给它分配一个密码,它将被储存在 `/etc/httpd/auth.basic`(可以随意选择另一个目录 和/或 文件名, 只要 Apache 对此有读取权限就可以。)
```
# htpasswd -c /etc/httpd/auth.basic adminganglia
```
给 adminganglia 输入两次密码完成密码设置。
3、 修改配置文件 `/etc/httpd/conf.d/ganglia.conf`:
```
Alias /ganglia /usr/share/ganglia
<Location /ganglia>
AuthType basic
AuthName "Ganglia web UI"
AuthBasicProvider file
AuthUserFile "/etc/httpd/auth.basic"
Require user adminganglia
</Location>
```
4、 编辑 `/etc/ganglia/gmetad.conf`:
首先,使用 `gridname` 指令来为网格设置一个描述性名称。
```
gridname "Home office"
```
然后,使用 `data_source` 指令,后面跟集群名(服务器组)、轮询时间间隔(秒)、主节点主机和被监控节点的 IP 地址:
```
data_source "Labs" 60 192.168.0.29:8649 # 主节点
data_source "Labs" 60 192.168.0.32 # 被监控节点
```
5、 编辑 `/etc/ganglia/gmond.conf`。
a) 确保集群的配置类似下面。
```
cluster {
name = "Labs" # gmetad.conf 中的 data_source 指令的名字
owner = "unspecified"
latlong = "unspecified"
url = "unspecified"
}
```
b) 在 `udp_send_chanel` 中,注释掉 `mcast_join`:
```
udp_send_channel {
# mcast_join = 239.2.11.71
host = localhost
port = 8649
ttl = 1
}
```
c) 在 `udp_recv_channel` 中,注释掉 `mcast_join` 和 `bind` 部分:
```
udp_recv_channel {
# mcast_join = 239.2.11.71 ## comment out
port = 8649
# bind = 239.2.11.71 ## comment out
}
```
保存并退出。
6、打开 8649/udp 端口,使用 SELinux 确保 php 脚本(通过 Apache 运行)能够连接到网络:
```
# firewall-cmd --add-port=8649/udp
# firewall-cmd --add-port=8649/udp --permanent
# setsebool -P httpd_can_network_connect 1
```
7、重启 Apache、gmetad、gmond,并确保它们启用了“开机启动”。
```
# systemctl restart httpd gmetad gmond
# systemctl enable httpd gmetad httpd
```
至此,我们现在能够打开 Ganglia 的 Web 页面 `http://192.168.0.29/ganglia` 并用步骤 2 中设置的凭证登录。
[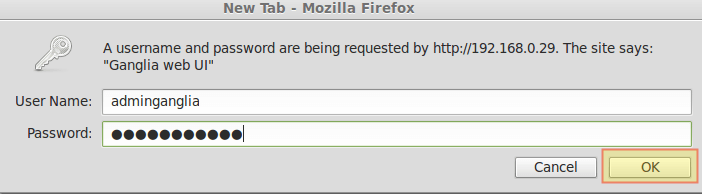][5]
*Gangila Web 页面*
8、 在 **Ubuntu** 主机上,只需安装 Ganglia-monitor,等同于 CentOS 上的 ganglia-gmond:
```
$ sudo aptitude update && aptitude install ganglia-monitor
```
9、 编辑被监控主机的 `/etc/ganglia/gmond.conf` 文件。与主节点主机上是相同的文件,除了被注释掉的 `cluster`, `udp_send_channel` , `udp_recv_channel` 这里不应被注释:
```
cluster {
name = "Labs" # The name in the data_source directive in gmetad.conf
owner = "unspecified"
latlong = "unspecified"
url = "unspecified"
}
udp_send_channel {
mcast_join = 239.2.11.71
host = localhost
port = 8649
ttl = 1
}
udp_recv_channel {
mcast_join = 239.2.11.71 ## comment out
port = 8649
bind = 239.2.11.71 ## comment out
}
```
之后重启服务。
```
$ sudo service ganglia-monitor restart
```
10、 刷新页面,你将在 Home office grid / Labs cluster 中看到两台主机的各种统计及图形化的展示(用下拉菜单选择集群,本例中为 Labs):
[][4]
*Ganglia 中 Home office 网格报告*
使用菜单按钮(如上指出的),你可以获取到每台服务器和集群的信息。还可以使用 <ruby>对比主机</ruby>Compare Hosts<rt></rt>选项卡来比较集群中所有服务器的状态。
可以使用正则表达式选择一组服务器,立刻就可以看到它们性能的对比:
[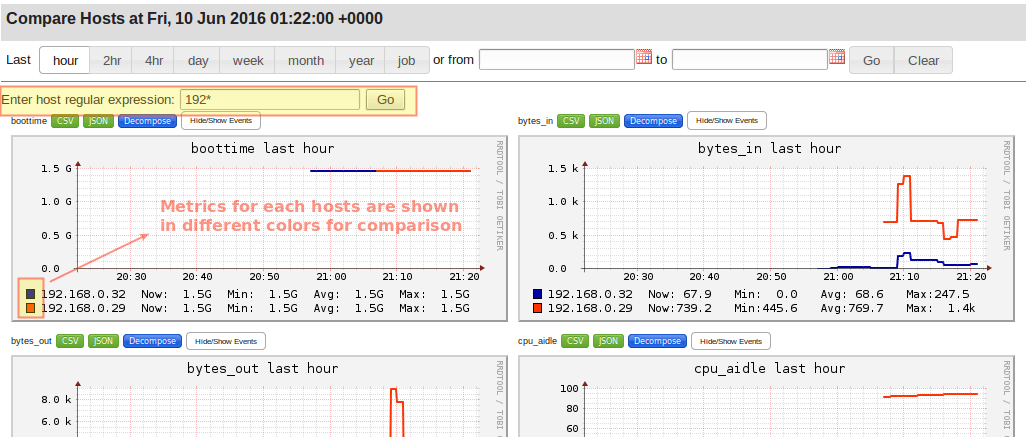][3]
*Ganglia 服务器信息*
我最喜欢的一个特点是对移动端有友好的总结界面,可以通过 Mobile 选项来访问。选择你感兴趣的集群,然后选中一个主机。
[][2]
*Ganglia 移动端总结截图*
### 总结
本篇文章向大家介绍了 Ganglia,它是一个功能强大、扩展性很好的监控工具,主要用来监控集群和网格。它可以随意安装,便捷的组合各种功能(你甚至可以尝试一下[官方网站][1] 提供的 Demo)。
此时,你可能会发现许多知名的 IT 或非 IT 的企业在使用 Ganglia。除了我们在文章中提及的之外,还有很多理由这样做,其中易用性,统计的图形化(在名字旁附上脸部照片更清晰,不是吗)可能是最重要的原因。
但是请不要拘泥于本篇文章,尝试一下自己去做。如果你有任何问题,欢迎给我留言。
--------------------------------------------------------------------------------
via: http://www.tecmint.com/install-configure-ganglia-monitoring-centos-linux/
作者:[Gabriel Cánepa][a]
译者:[ivo-wang](https://github.com/ivo-wang)
校对:[jasminepeng](https://github.com/jasminepeng)
本文由 [LCTT](https://github.com/LCTT/TranslateProject) 组织编译,[Linux中国](https://linux.cn/) 荣誉推出
[a]: http://www.tecmint.com/author/gacanepa/
[1]:http://ganglia.info/
[2]:http://www.tecmint.com/wp-content/uploads/2016/06/Ganglia-Mobile-View.png
[3]:http://www.tecmint.com/wp-content/uploads/2016/06/Ganglia-Server-Information.png
[4]:http://www.tecmint.com/wp-content/uploads/2016/06/Ganglia-Home-Office-Grid-Report.png
[5]:http://www.tecmint.co m/wp-content/uploads/2016/06/Gangila-Web-Interface.png
[6]:http://httpd.apache.org/docs/current/howto/auth.html
[7]:https://linux.cn/article-2324-1.html
[8]:http://www.tecmint.com/wp-content/uploads/2016/06/ Install-Gangila-Monitoring-in-Linux.png
[9]:http://www.tecmint.com/install-icinga-in-centos-7/
[10]:http://www.tecmint.com/install-and-configure-zabbix-monitoring-on-debian-centos-rhel/
[11]:http://www.tecmint.com/install-nagios-in-linux/