mirror of
https://github.com/LCTT/TranslateProject.git
synced 2025-01-16 22:42:21 +08:00
154 lines
9.7 KiB
Markdown
154 lines
9.7 KiB
Markdown
|
|
How to write your favorite R functions in Python
|
|||
|
|
======
|
|||
|
|
R or Python? This Python script mimics convenient R-style functions for doing statistics nice and easy.
|
|||
|
|
|
|||
|
|

|
|||
|
|
|
|||
|
|
One of the great modern battles of data science and machine learning is "Python vs. R." There is no doubt that both have gained enormous ground in recent years to become top programming languages for data science, predictive analytics, and machine learning. In fact, according to a recent IEEE article, Python overtook C++ as the [top programming language][1] and R firmly secured its spot in the top 10.
|
|||
|
|
|
|||
|
|
However, there are some fundamental differences between these two. [R was developed primarily][2] as a tool for statistical analysis and quick prototyping of a data analysis problem. Python, on the other hand, was developed as a general purpose, modern object-oriented language in the same vein as C++ or Java but with a simpler learning curve and more flexible demeanor. Consequently, R continues to be extremely popular among statisticians, quantitative biologists, physicists, and economists, whereas Python has slowly emerged as the top language for day-to-day scripting, automation, backend web development, analytics, and general machine learning frameworks and has an extensive support base and open source development community work.
|
|||
|
|
|
|||
|
|
### Mimicking functional programming in a Python environment
|
|||
|
|
|
|||
|
|
[R's nature as a functional programming language][3] provides users with an extremely simple and compact interface for quick calculations of probabilities and essential descriptive/inferential statistics for a data analysis problem. For example, wouldn't it be great to be able to solve the following problems with just a single, compact function call?
|
|||
|
|
|
|||
|
|
* How to calculate the mean/median/mode of a data vector.
|
|||
|
|
* How to calculate the cumulative probability of some event following a normal distribution. What if the distribution is Poisson?
|
|||
|
|
* How to calculate the inter-quartile range of a series of data points.
|
|||
|
|
* How to generate a few random numbers following a Student's t-distribution.
|
|||
|
|
|
|||
|
|
|
|||
|
|
|
|||
|
|
The R programming environment can do all of these.
|
|||
|
|
|
|||
|
|
On the other hand, Python's scripting ability allows analysts to use those statistics in a wide variety of analytics pipelines with limitless sophistication and creativity.
|
|||
|
|
|
|||
|
|
To combine the advantages of both worlds, you just need a simple Python-based wrapper library that contains the most commonly used functions pertaining to probability distributions and descriptive statistics defined in R-style. This enables you to call those functions really fast without having to go to the proper Python statistical libraries and figure out the whole list of methods and arguments.
|
|||
|
|
|
|||
|
|
### Python wrapper script for most convenient R-functions
|
|||
|
|
|
|||
|
|
[I wrote a Python script][4] to define the most convenient and widely used R-functions in simple, statistical analysis—in Python. After importing this script, you will be able to use those R-functions naturally, just like in an R programming environment.
|
|||
|
|
|
|||
|
|
The goal of this script is to provide simple Python subroutines mimicking R-style statistical functions for quickly calculating density/point estimates, cumulative distributions, and quantiles and generating random variates for important probability distributions.
|
|||
|
|
|
|||
|
|
To maintain the spirit of R styling, the script uses no class hierarchy and only raw functions are defined in the file. Therefore, a user can import this one Python script and use all the functions whenever they're needed with a single name call.
|
|||
|
|
|
|||
|
|
Note that I use the word mimic. Under no circumstance am I claiming to emulate R's true functional programming paradigm, which consists of a deep environmental setup and complex relationships between those environments and objects. This script allows me (and I hope countless other Python users) to quickly fire up a Python program or Jupyter notebook, import the script, and start doing simple descriptive statistics in no time. That's the goal, nothing more, nothing less.
|
|||
|
|
|
|||
|
|
If you've coded in R (maybe in grad school) and are just starting to learn and use Python for data analysis, you will be happy to see and use some of the same well-known functions in your Jupyter notebook in a manner similar to how you use them in your R environment.
|
|||
|
|
|
|||
|
|
Whatever your reason, using this script is fun.
|
|||
|
|
|
|||
|
|
### Simple examples
|
|||
|
|
|
|||
|
|
To start, just import the script and start working with lists of numbers as if they were data vectors in R.
|
|||
|
|
|
|||
|
|
```
|
|||
|
|
from R_functions import *
|
|||
|
|
lst=[20,12,16,32,27,65,44,45,22,18]
|
|||
|
|
<more code, more statistics...>
|
|||
|
|
```
|
|||
|
|
|
|||
|
|
Say you want to calculate the [Tuckey five-number][5] summary from a vector of data points. You just call one simple function, **fivenum** , and pass on the vector. It will return the five-number summary in a NumPy array.
|
|||
|
|
|
|||
|
|
```
|
|||
|
|
lst=[20,12,16,32,27,65,44,45,22,18]
|
|||
|
|
fivenum(lst)
|
|||
|
|
> array([12. , 18.5, 24.5, 41. , 65. ])
|
|||
|
|
```
|
|||
|
|
|
|||
|
|
Maybe you want to know the answer to the following question:
|
|||
|
|
|
|||
|
|
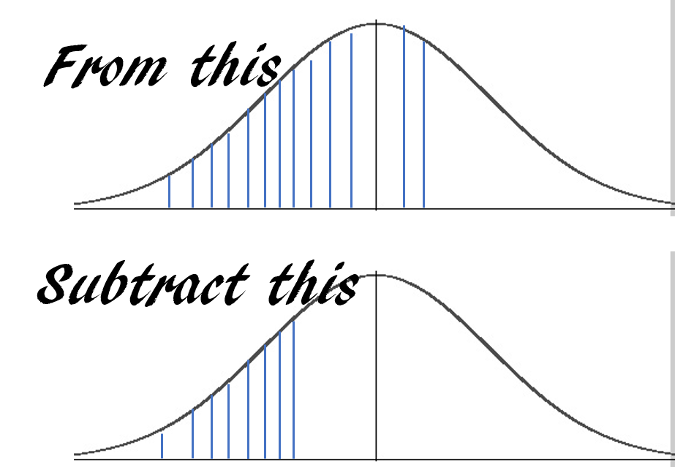
Suppose a machine outputs 10 finished goods per hour on average with a standard deviation of 2. The output pattern follows a near normal distribution. What is the probability that the machine will output at least 7 but no more than 12 units in the next hour?
|
|||
|
|
|
|||
|
|
The answer is essentially this:
|
|||
|
|
|
|||
|
|

|
|||
|
|
|
|||
|
|
You can obtain the answer with just one line of code using **pnorm** :
|
|||
|
|
|
|||
|
|
```
|
|||
|
|
pnorm(12,10,2)-pnorm(7,10,2)
|
|||
|
|
> 0.7745375447996848
|
|||
|
|
```
|
|||
|
|
|
|||
|
|
Or maybe you need to answer the following:
|
|||
|
|
|
|||
|
|
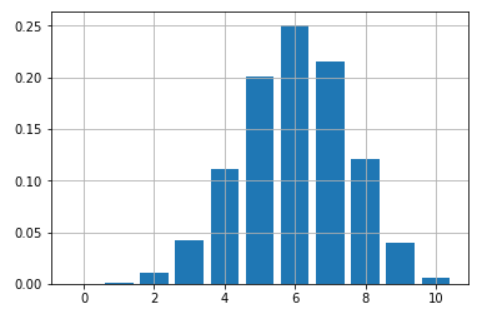
Suppose you have a loaded coin with the probability of turning heads up 60% every time you toss it. You are playing a game of 10 tosses. How do you plot and map out the chances of all the possible number of wins (from 0 to 10) with this coin?
|
|||
|
|
|
|||
|
|
You can obtain a nice bar chart with just a few lines of code using just one function, **dbinom** :
|
|||
|
|
|
|||
|
|
```
|
|||
|
|
probs=[]
|
|||
|
|
import matplotlib.pyplot as plt
|
|||
|
|
for i in range(11):
|
|||
|
|
probs.append(dbinom(i,10,0.6))
|
|||
|
|
plt.bar(range(11),height=probs)
|
|||
|
|
plt.grid(True)
|
|||
|
|
plt.show()
|
|||
|
|
```
|
|||
|
|
|
|||
|
|

|
|||
|
|
|
|||
|
|
### Simple interface for probability calculations
|
|||
|
|
|
|||
|
|
R offers an extremely simple and intuitive interface for quick calculations from essential probability distributions. The interface goes like this:
|
|||
|
|
|
|||
|
|
* **d** {distribution} gives the density function value at a point **x**
|
|||
|
|
* **p** {distribution} gives the cumulative value at a point **x**
|
|||
|
|
* **q** {distribution} gives the quantile function value at a probability **p**
|
|||
|
|
* **r** {distribution} generates one or multiple random variates
|
|||
|
|
|
|||
|
|
|
|||
|
|
|
|||
|
|
In our implementation, we stick to this interface and its associated argument list so you can execute these functions exactly like you would in an R environment.
|
|||
|
|
|
|||
|
|
### Currently implemented functions
|
|||
|
|
|
|||
|
|
The following R-style functions are implemented in the script for fast calling.
|
|||
|
|
|
|||
|
|
* Mean, median, variance, standard deviation
|
|||
|
|
* Tuckey five-number summary, IQR
|
|||
|
|
* Covariance of a matrix or between two vectors
|
|||
|
|
* Density, cumulative probability, quantile function, and random variate generation for the following distributions: normal, uniform, binomial, Poisson, F, Student's t, Chi-square, beta, and gamma.
|
|||
|
|
|
|||
|
|
|
|||
|
|
|
|||
|
|
### Work in progress
|
|||
|
|
|
|||
|
|
Obviously, this is a work in progress, and I plan to add some other convenient R-functions to this script. For example, in R, a single line of command **lm** can get you an ordinary least-square fitted model to a numerical dataset with all the necessary inferential statistics (P-values, standard error, etc.). This is powerfully brief and compact! On the other hand, standard linear regression problems in Python are often tackled using [Scikit-learn][6], which needs a bit more scripting for this use, so I plan to incorporate this single function linear model fitting feature using Python's [statsmodels][7] backend.
|
|||
|
|
|
|||
|
|
If you like and use this script in your work, please help others find it by starring or forking its [GitHub repository][8]. Also, you can check my other [GitHub repos][9] for fun code snippets in Python, R, or MATLAB and some machine learning resources.
|
|||
|
|
|
|||
|
|
If you have any questions or ideas to share, please contact me at [tirthajyoti[AT]gmail.com][10]. If you are, like me, passionate about machine learning and data science, please [add me on LinkedIn][11] or [follow me on Twitter. ][12]
|
|||
|
|
|
|||
|
|
Originally published on [Towards Data Science][13]. Reposted under [CC BY-SA 4.0][14].
|
|||
|
|
|
|||
|
|
--------------------------------------------------------------------------------
|
|||
|
|
|
|||
|
|
via: https://opensource.com/article/18/10/write-favorite-r-functions-python
|
|||
|
|
|
|||
|
|
作者:[Tirthajyoti Sarkar][a]
|
|||
|
|
选题:[lujun9972][b]
|
|||
|
|
译者:[译者ID](https://github.com/译者ID)
|
|||
|
|
校对:[校对者ID](https://github.com/校对者ID)
|
|||
|
|
|
|||
|
|
本文由 [LCTT](https://github.com/LCTT/TranslateProject) 原创编译,[Linux中国](https://linux.cn/) 荣誉推出
|
|||
|
|
|
|||
|
|
[a]: https://opensource.com/users/tirthajyoti
|
|||
|
|
[b]: https://github.com/lujun9972
|
|||
|
|
[1]: https://spectrum.ieee.org/at-work/innovation/the-2018-top-programming-languages
|
|||
|
|
[2]: https://www.coursera.org/lecture/r-programming/overview-and-history-of-r-pAbaE
|
|||
|
|
[3]: http://adv-r.had.co.nz/Functional-programming.html
|
|||
|
|
[4]: https://github.com/tirthajyoti/StatsUsingPython/blob/master/R_Functions.py
|
|||
|
|
[5]: https://en.wikipedia.org/wiki/Five-number_summary
|
|||
|
|
[6]: http://scikit-learn.org/stable/
|
|||
|
|
[7]: https://www.statsmodels.org/stable/index.html
|
|||
|
|
[8]: https://github.com/tirthajyoti/StatsUsingPython
|
|||
|
|
[9]: https://github.com/tirthajyoti?tab=repositories
|
|||
|
|
[10]: mailto:tirthajyoti@gmail.com
|
|||
|
|
[11]: https://www.linkedin.com/in/tirthajyoti-sarkar-2127aa7/
|
|||
|
|
[12]: https://twitter.com/tirthajyotiS
|
|||
|
|
[13]: https://towardsdatascience.com/how-to-write-your-favorite-r-functions-in-python-11e1e9c29089
|
|||
|
|
[14]: https://creativecommons.org/licenses/by-sa/4.0/
|