TranslateProject/sources/talk/20150709 7 command line tools for monitoring your Linux system.md

80 lines
6.2 KiB
Markdown
Raw Normal View History

2015-07-13 11:39:33 +08:00
监控你的Linux系统的7个命令行工具
2015-07-09 15:55:02 +08:00
================================================================================
2015-07-13 11:39:33 +08:00
**这里有一些基本的命令行工具让你能更简单地探索和操作Linux。**
2015-07-09 15:55:02 +08:00
![Image courtesy Meltys-stock](http://images.techhive.com/images/article/2015/06/command-line-tools-monitoring-linux-system-1-100591899-orig.png)
2015-07-13 11:39:33 +08:00
### 深入 ###
2015-07-09 15:55:02 +08:00
2015-07-13 11:39:33 +08:00
关于Linux最棒的一件事之一是你能深入操作系统多深来探索它是如何工作的并寻找机会来微调性能或诊断问题。这里有一些基本的命令行工具让你能更简单地探索和操作Linux。大多数的这些命令是在你的Linux系统中已经内建的但假设它们不是就用谷歌搜索命令名和你的发行版名吧你会找到哪些包需要安装(注意,一些命令是和其它命令捆绑起来打成一个包的,你所找的包可能写的是其它的名字)。如果你知道一些你所使用的其它工具,欢迎评论。
2015-07-09 15:55:02 +08:00
![Image courtesy Mark Gibbs](http://images.techhive.com/images/article/2015/06/command-line-tools-monitoring-linux-system-2-100591901-orig.png)
2015-07-16 15:49:52 +08:00
### 我们怎么做 ###
2015-07-09 15:55:02 +08:00
2015-07-16 15:49:52 +08:00
须知: 本文中的截图取自[Debian Linux 8.1][1] (“Jessie”),其运行在[OS X 10.10.3][3] (“Yosemite”)操作系统下[Oracle VirtualBox 4.3.28][2]中的一台虚拟机里。想要建立你的Debian虚拟机可以看看我的这篇教程——“[How to install Debian Linux in a VirtualBox VM][4]”。
2015-07-09 15:55:02 +08:00
![Image courtesy Mark Gibbs](http://images.techhive.com/images/article/2015/06/command-line-tools-monitoring-linux-system-3-100591902-orig.png)
2015-07-16 15:49:52 +08:00
### Top ###
2015-07-09 15:55:02 +08:00
2015-07-14 17:54:06 +08:00
作为Linux系统监控工具中比较易用的一个**top命令**能带我们一览Linux中的几乎每一处。以下这张图是它的默认界面但是按“z”键可以切换不同的显示颜色。其它热键和命令则有其它的功能例如显示概要信息和内存信息(第四行第二个),根据各种不一样的条件排序、终止进程任务等等(你可以在[这里][5]找到完整的列表)。
2015-07-09 15:55:02 +08:00
![Image courtesy Mark Gibbs](http://images.techhive.com/images/article/2015/06/command-line-tools-monitoring-linux-system-4-100591904-orig.png)
### htop ###
2015-07-16 15:49:52 +08:00
相比top它的替代品Htop则更为精致。维基百科是这样描述的“用户经常会部署htop以防Unix top不能提供关于系统进程的足够信息比如说当你在尝试发现应用程序里的一个小的内存泄露问题Htop一般也能作为一个系统监听器来使用。相比top它提供了一个更方便的光标控制界面来向进程发送信号。” (想了解更多细节猛戳[这里][6].)
2015-07-09 15:55:02 +08:00
![Image courtesy Mark Gibbs](http://images.techhive.com/images/article/2015/06/command-line-tools-monitoring-linux-system-5-100591903-orig.png)
### Vmstat ###
2015-07-17 16:58:56 +08:00
Vmstat是一款监控Linux系统性能数据的简易工具这让它在shell脚本中使用更合适。打开你的regex-fu用vmstat和cron作业来做一些激动人心的事情吧。“产出的第一份报告给出的是上一次系统重启之后的均值另外其一份报告给出的则是从前一个报告起间隔周期中的信息。进程和内存报告在任何情况下都是不停更新的”(猛戳[这里][7]获取更多信息)。
2015-07-09 15:55:02 +08:00
![Image courtesy Mark Gibbs](http://images.techhive.com/images/article/2015/06/command-line-tools-monitoring-linux-system-6-100591905-orig.png)
### ps ###
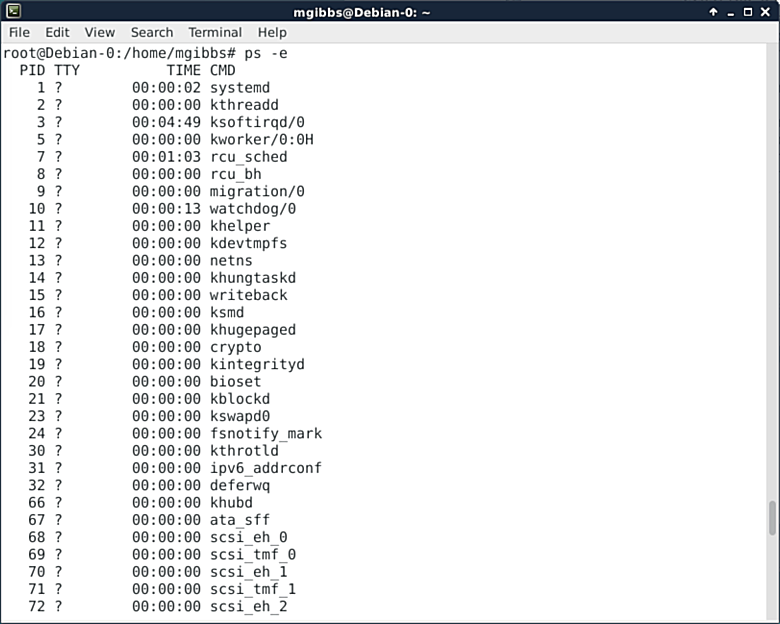
The ps command shows a list of running processes. In this case, Ive used the “-e”switch to show everything, that is, all processes running (Ive scrolled back to the top of the output otherwise the column names wouldnt be visible). This command has a lot of switches that allow you to format the output as needed. Add a little of the aforementioned regex-fu and youve got a powerful tool. Go [here][8] for the full details.
![Image courtesy Mark Gibbs](http://images.techhive.com/images/article/2015/06/command-line-tools-monitoring-linux-system-7-100591906-orig.png)
### Pstree ###
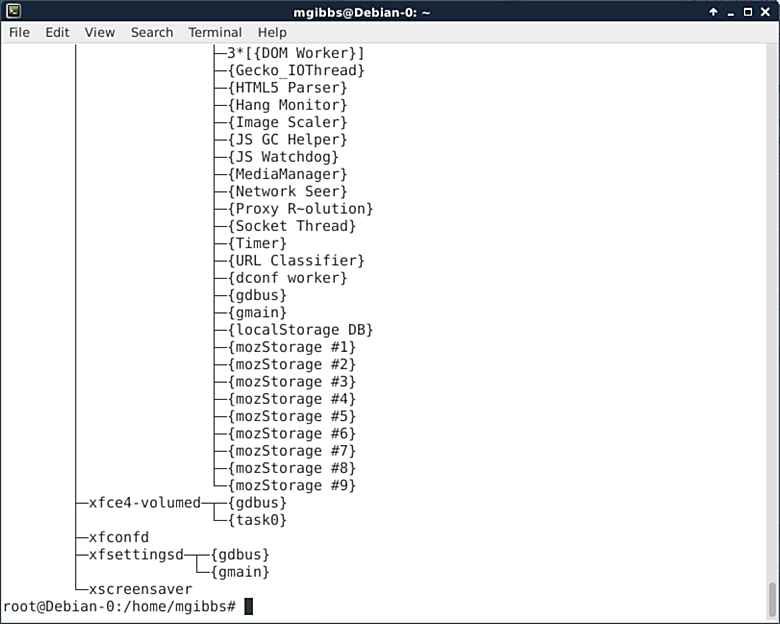
Pstree “shows running processes as a tree. The tree is rooted at either pid or init if pid is omitted. If a user name is specified, all process trees rooted at processes owned by that user are shown.”This is a really useful tool as the tree helps you sort out which process is dependent on which process (go [here][9]).
![Image courtesy Mark Gibbs](http://images.techhive.com/images/article/2015/06/command-line-tools-monitoring-linux-system-8-100591907-orig.png)
### pmap ###
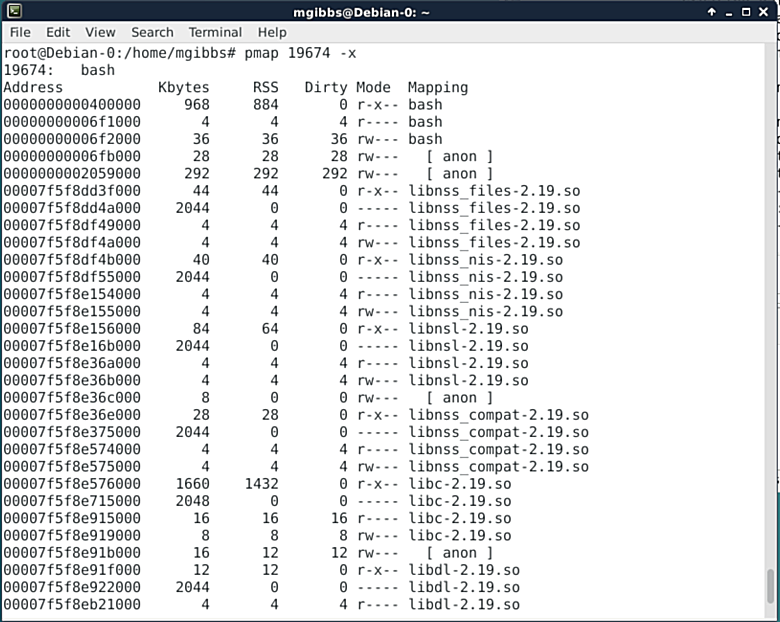
Understanding just how an app uses memory is often crucial in debugging, and the pmap produces just such information when given a process ID (PID). The screenshot shows the medium weight output generated by using the “-x”switch. You can get pmap to produce even more detailed information using the “-X”switch but youll need a much wider terminal window.
![Image courtesy Mark Gibbs](http://images.techhive.com/images/article/2015/06/command-line-tools-monitoring-linux-system-9-100591900-orig.png)
### iostat ###
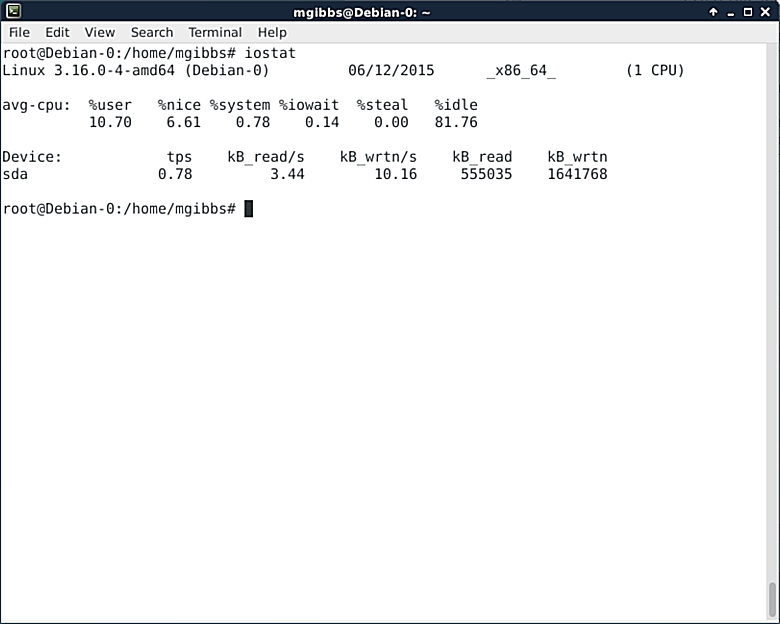
A crucial factor in your Linux systems performance is processor and storage usage, which are what the iostat command reports on. As with the ps command, iostat has loads of switches that allow you to select the output format you need as well as sample performance over a time period and then repeat that sampling a number of times before reporting. See [here][10].
--------------------------------------------------------------------------------
via: http://www.networkworld.com/article/2937219/linux/7-command-line-tools-for-monitoring-your-linux-system.html
作者:[Mark Gibbs][a]
译者:[译者ID](https://github.com/译者ID)
校对:[校对者ID](https://github.com/校对者ID)
本文由 [LCTT](https://github.com/LCTT/TranslateProject) 原创翻译,[Linux中国](https://linux.cn/) 荣誉推出
[a]:http://www.networkworld.com/author/Mark-Gibbs/
[1]:https://www.debian.org/releases/stable/
[2]:https://www.virtualbox.org/
[3]:http://www.apple.com/osx/
[4]:http://www.networkworld.com/article/2937148/how-to-install-debian-linux-8-1-in-a-virtualbox-vm
[5]:http://linux.die.net/man/1/top
[6]:http://linux.die.net/man/1/htop
[7]:http://linuxcommand.org/man_pages/vmstat8.html
[8]:http://linux.die.net/man/1/ps
[9]:http://linux.die.net/man/1/pstree
2015-07-10 17:48:15 +08:00
[10]:http://linux.die.net/man/1/iostat