mirror of
https://github.com/LCTT/TranslateProject.git
synced 2025-01-07 22:11:09 +08:00
167 lines
9.3 KiB
Markdown
167 lines
9.3 KiB
Markdown
|
|
[#]: collector: (lujun9972)
|
|||
|
|
[#]: translator: ( )
|
|||
|
|
[#]: reviewer: ( )
|
|||
|
|
[#]: publisher: ( )
|
|||
|
|
[#]: url: ( )
|
|||
|
|
[#]: subject: (Getting started with Prometheus)
|
|||
|
|
[#]: via: (https://opensource.com/article/18/12/introduction-prometheus)
|
|||
|
|
[#]: author: (Michael Zamot https://opensource.com/users/mzamot)
|
|||
|
|
|
|||
|
|
Getting started with Prometheus
|
|||
|
|
======
|
|||
|
|
Learn to install and write queries for the Prometheus monitoring and alerting system.
|
|||
|
|

|
|||
|
|
|
|||
|
|
[Prometheus][1] is an open source monitoring and alerting system that directly scrapes metrics from agents running on the target hosts and stores the collected samples centrally on its server. Metrics can also be pushed using plugins like **collectd_exporter** —although this is not Promethius' default behavior, it may be useful in some environments where hosts are behind a firewall or prohibited from opening ports by security policy.
|
|||
|
|
|
|||
|
|
Prometheus, a project of the [Cloud Native Computing Foundation][2], scales up using a federation model, which enables one Prometheus server to scrape another Prometheus server. This allows creation of a hierarchical topology, where a central system or higher-level Prometheus server can scrape aggregated data already collected from subordinate instances.
|
|||
|
|
|
|||
|
|
Besides the Prometheus server, its most common components are its [Alertmanager][3] and its exporters.
|
|||
|
|
|
|||
|
|
Alerting rules can be created within Prometheus and configured to send custom alerts to Alertmanager. Alertmanager then processes and handles these alerts, including sending notifications through different mechanisms like email or third-party services like [PagerDuty][4].
|
|||
|
|
|
|||
|
|
Prometheus' exporters can be libraries, processes, devices, or anything else that exposes the metrics that will be scraped by Prometheus. The metrics are available at the endpoint **/metrics** , which allows Prometheus to scrape them directly without needing an agent. The tutorial in this article uses **node_exporter** to expose the target hosts' hardware and operating system metrics. Exporters' outputs are plaintext and highly readable, which is one of Prometheus' strengths.
|
|||
|
|
|
|||
|
|
In addition, you can configure [Grafana][5] to use Prometheus as a backend to provide data visualization and dashboarding functions.
|
|||
|
|
|
|||
|
|
### Making sense of Prometheus' configuration file
|
|||
|
|
|
|||
|
|
The number of seconds between when **/metrics** is scraped controls the granularity of the time-series database. This is defined in the configuration file as the **scrape_interval** parameter, which by default is set to 60 seconds.
|
|||
|
|
|
|||
|
|
Targets are set for each scrape job in the **scrape_configs** section. Each job has its own name and a set of labels that can help filter, categorize, and make it easier to identify the target. One job can have many targets.
|
|||
|
|
|
|||
|
|
### Installing Prometheus
|
|||
|
|
|
|||
|
|
In this tutorial, for simplicity, we will install a Prometheus server and **node_exporter** with docker. Docker should already be installed and configured properly on your system. For a more in-depth, automated method, I recommend Steve Ovens' article [How to use Ansible to set up system monitoring with Prometheus][6].
|
|||
|
|
|
|||
|
|
Before starting, create the Prometheus configuration file **prometheus.yml** in your work directory as follows:
|
|||
|
|
|
|||
|
|
```
|
|||
|
|
global:
|
|||
|
|
scrape_interval: 15s
|
|||
|
|
evaluation_interval: 15s
|
|||
|
|
|
|||
|
|
scrape_configs:
|
|||
|
|
- job_name: 'prometheus'
|
|||
|
|
|
|||
|
|
static_configs:
|
|||
|
|
- targets: ['localhost:9090']
|
|||
|
|
|
|||
|
|
- job_name: 'webservers'
|
|||
|
|
|
|||
|
|
static_configs:
|
|||
|
|
- targets: ['<node exporter node IP>:9100']
|
|||
|
|
```
|
|||
|
|
|
|||
|
|
Start Prometheus with Docker by running the following command:
|
|||
|
|
|
|||
|
|
```
|
|||
|
|
$ sudo docker run -d -p 9090:9090 -v
|
|||
|
|
/path/to/prometheus.yml:/etc/prometheus/prometheus.yml
|
|||
|
|
prom/prometheus
|
|||
|
|
```
|
|||
|
|
|
|||
|
|
By default, the Prometheus server will use port 9090. If this port is already in use, you can change it by adding the parameter **\--web.listen-address=" <IP of machine>:<port>"** at the end of the previous command.
|
|||
|
|
|
|||
|
|
In the machine you want to monitor, download and run the **node_exporter** container by using the following command:
|
|||
|
|
|
|||
|
|
```
|
|||
|
|
$ sudo docker run -d -v "/proc:/host/proc" -v "/sys:/host/sys" -v
|
|||
|
|
"/:/rootfs" --net="host" prom/node-exporter --path.procfs
|
|||
|
|
/host/proc --path.sysfs /host/sys --collector.filesystem.ignored-
|
|||
|
|
mount-points "^/(sys|proc|dev|host|etc)($|/)"
|
|||
|
|
```
|
|||
|
|
|
|||
|
|
For the purposes of this learning exercise, you can install **node_exporter** and Prometheus on the same machine. Please note that it's not wise to run **node_exporter** under Docker in production—this is for testing purposes only.
|
|||
|
|
|
|||
|
|
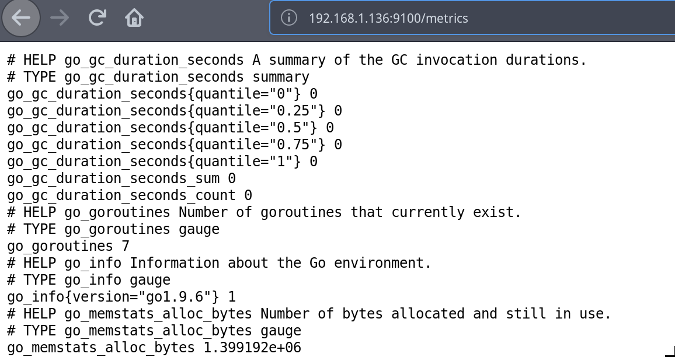
To verify that **node_exporter** is running, open your browser and navigate to **http:// <IP of Node exporter host>:9100/metrics**. All the metrics collected will be displayed; these are the same metrics Prometheus will scrape.
|
|||
|
|
|
|||
|
|

|
|||
|
|
|
|||
|
|
To verify the Prometheus server installation, open your browser and navigate to <http://localhost:9090>.
|
|||
|
|
|
|||
|
|
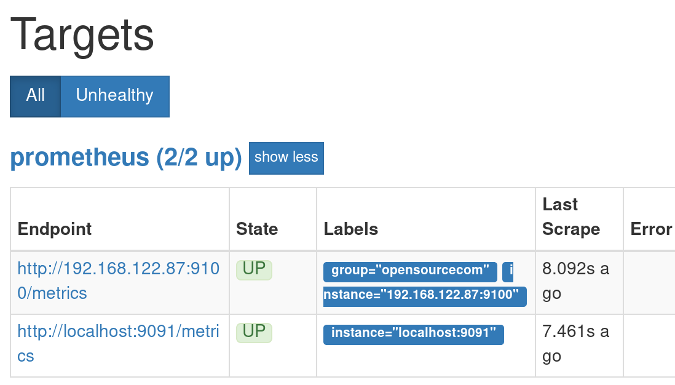
You should see the Prometheus interface. Click on **Status** and then **Targets**. Under State, you should see your machines listed as **UP**.
|
|||
|
|
|
|||
|
|

|
|||
|
|
|
|||
|
|
### Using Prometheus queries
|
|||
|
|
|
|||
|
|
It's time to get familiar with [PromQL][7], Prometheus' query syntax, and its graphing web interface. Go to **<http://localhost:9090/graph>** on your Prometheus server. You will see a query editor and two tabs: Graph and Console.
|
|||
|
|
|
|||
|
|
Prometheus stores all data as time series, identifying each one with a metric name. For example, the metric **node_filesystem_avail_bytes** shows the available filesystem space. The metric's name can be used in the expression box to select all of the time series with this name and produce an instant vector. If desired, these time series can be filtered using selectors and labels—a set of key-value pairs—for example:
|
|||
|
|
|
|||
|
|
```
|
|||
|
|
node_filesystem_avail_bytes{fstype="ext4"}
|
|||
|
|
```
|
|||
|
|
|
|||
|
|
When filtering, you can match "exactly equal" ( **=** ), "not equal" ( **!=** ), "regex-match" ( **=~** ), and "do not regex-match" ( **!~** ). The following examples illustrate this:
|
|||
|
|
|
|||
|
|
To filter **node_filesystem_avail_bytes** to show both ext4 and XFS filesystems:
|
|||
|
|
|
|||
|
|
```
|
|||
|
|
node_filesystem_avail_bytes{fstype=~"ext4|xfs"}
|
|||
|
|
```
|
|||
|
|
|
|||
|
|
To exclude a match:
|
|||
|
|
|
|||
|
|
```
|
|||
|
|
node_filesystem_avail_bytes{fstype!="xfs"}
|
|||
|
|
```
|
|||
|
|
|
|||
|
|
You can also get a range of samples back from the current time by using square brackets. You can use **s** to represent seconds, **m** for minutes, **h** for hours, **d** for days, **w** for weeks, and **y** for years. When using time ranges, the vector returned will be a range vector.
|
|||
|
|
|
|||
|
|
For example, the following command produces the samples from five minutes to the present:
|
|||
|
|
|
|||
|
|
```
|
|||
|
|
node_memory_MemAvailable_bytes[5m]
|
|||
|
|
```
|
|||
|
|
|
|||
|
|
Prometheus also includes functions to allow advanced queries, such as this:
|
|||
|
|
|
|||
|
|
```
|
|||
|
|
100 core.md Dict.md lctt2014.md lctt2016.md lctt2018.md LICENSE published README.md scripts sources translated (1 - avg by(instance)(irate(node_cpu_seconds_total{job='webservers',mode='idle'}[5m])))
|
|||
|
|
```
|
|||
|
|
|
|||
|
|
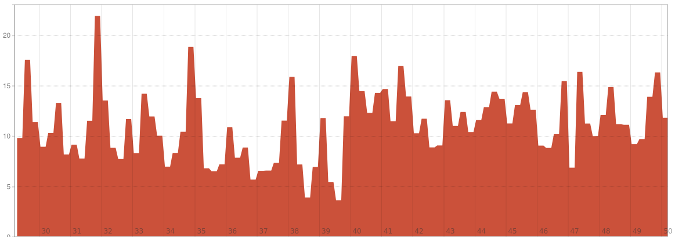
Notice how the labels are used to filter the job and the mode. The metric **node_cpu_seconds_total** returns a counter, and the **irate()** function calculates the per-second rate of change based on the last two data points of the range interval (meaning the range can be smaller than five minutes). To calculate the overall CPU usage, you can use the idle mode of the **node_cpu_seconds_total** metric. The idle percent of a processor is the opposite of a busy processor, so the **irate** value is subtracted from 1. To make it a percentage, multiply it by 100.
|
|||
|
|
|
|||
|
|

|
|||
|
|
|
|||
|
|
### Learn more
|
|||
|
|
|
|||
|
|
Prometheus is a powerful, scalable, lightweight, and easy to use and deploy monitoring tool that is indispensable for every system administrator and developer. For these and other reasons, many companies are implementing Prometheus as part of their infrastructure.
|
|||
|
|
|
|||
|
|
To learn more about Prometheus and its functions, I recommend the following resources:
|
|||
|
|
|
|||
|
|
+ About [PromQL][8]
|
|||
|
|
+ What [node_exporters collects][9]
|
|||
|
|
+ [Prometheus functions][10]
|
|||
|
|
+ [4 open source monitoring tools][11]
|
|||
|
|
+ [Now available: The open source guide to DevOps monitoring tools][12]
|
|||
|
|
|
|||
|
|
|
|||
|
|
--------------------------------------------------------------------------------
|
|||
|
|
|
|||
|
|
via: https://opensource.com/article/18/12/introduction-prometheus
|
|||
|
|
|
|||
|
|
作者:[Michael Zamot][a]
|
|||
|
|
选题:[lujun9972][b]
|
|||
|
|
译者:[译者ID](https://github.com/译者ID)
|
|||
|
|
校对:[校对者ID](https://github.com/校对者ID)
|
|||
|
|
|
|||
|
|
本文由 [LCTT](https://github.com/LCTT/TranslateProject) 原创编译,[Linux中国](https://linux.cn/) 荣誉推出
|
|||
|
|
|
|||
|
|
[a]: https://opensource.com/users/mzamot
|
|||
|
|
[b]: https://github.com/lujun9972
|
|||
|
|
[1]: https://prometheus.io/
|
|||
|
|
[2]: https://www.cncf.io/
|
|||
|
|
[3]: https://prometheus.io/docs/alerting/alertmanager/
|
|||
|
|
[4]: https://en.wikipedia.org/wiki/PagerDuty
|
|||
|
|
[5]: https://grafana.com/
|
|||
|
|
[6]: https://opensource.com/article/18/3/how-use-ansible-set-system-monitoring-prometheus
|
|||
|
|
[7]: https://prometheus.io/docs/prometheus/latest/querying/basics/
|
|||
|
|
[8]: https://prometheus.io/docs/prometheus/latest/querying/basics/
|
|||
|
|
[9]: https://github.com/prometheus/node_exporter#collectors
|
|||
|
|
[10]: https://prometheus.io/docs/prometheus/latest/querying/functions/
|
|||
|
|
[11]: https://opensource.com/article/18/8/open-source-monitoring-tools
|
|||
|
|
[12]: https://opensource.com/article/18/8/now-available-open-source-guide-devops-monitoring-tools
|