2018-09-23 15:12:16 +08:00
|
|
|
|
最好的 3 个开源 JavaScript 图表库
|
2018-09-07 11:20:14 +08:00
|
|
|
|
======
|
2018-09-24 07:55:20 +08:00
|
|
|
|
> 图表及其它可视化方式让传递数据的信息变得更简单。
|
2018-09-07 11:20:14 +08:00
|
|
|
|
|
|
|
|
|
|

|
|
|
|
|
|
|
2018-09-24 07:55:20 +08:00
|
|
|
|
对于数据可视化和制作精美网站来说,图表和图形很重要。视觉上的展示让分析大块数据及传递信息变得更简单。JavaScript 图表库能让数据以极好的、易于理解的和交互的方式进行可视化,还能够优化你的网站设计。
|
2018-09-07 11:20:14 +08:00
|
|
|
|
|
2018-09-23 15:12:16 +08:00
|
|
|
|
本文会带你学习最好的 3 个开源 JavaScript 图表库。
|
2018-09-07 11:20:14 +08:00
|
|
|
|
|
2018-09-24 07:55:20 +08:00
|
|
|
|
### 1、 Chart.js
|
2018-09-07 11:20:14 +08:00
|
|
|
|
|
2018-09-23 15:12:16 +08:00
|
|
|
|
[Chart.js][1] 是一个开源的 JavaScript 库,你可以在自己的应用中用它创建生动美丽和交互式的图表。使用它需要遵循 MIT 协议。
|
|
|
|
|
|
|
2018-09-24 07:55:20 +08:00
|
|
|
|
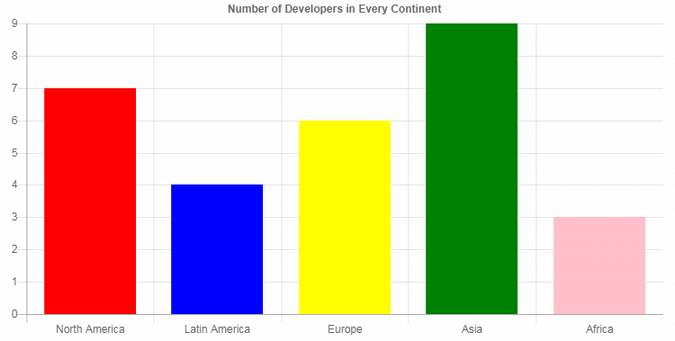
使用 Chart.js,你可以创建各种各样令人印象深刻的图表和图形,包括条形图、折线图、范围图、线性标度和散点图。它可以响应各种设备,使用 HTML5 Canvas 元素进行绘制。
|
2018-09-07 11:20:14 +08:00
|
|
|
|
|
2018-09-24 07:55:20 +08:00
|
|
|
|
示例代码如下,它使用该库绘制了一个条形图。本例中我们使用 Chart.js 的内容分发网络(CDN)来包含这个库。注意这里使用的数据仅用于展示。
|
2018-09-07 11:20:14 +08:00
|
|
|
|
|
|
|
|
|
|
```
|
|
|
|
|
|
<!DOCTYPE html>
|
|
|
|
|
|
<html>
|
|
|
|
|
|
<head>
|
|
|
|
|
|
<script src="https://cdnjs.cloudflare.com/ajax/libs/Chart.js/2.5.0/Chart.min.js"></script>
|
|
|
|
|
|
</head>
|
|
|
|
|
|
|
|
|
|
|
|
<body>
|
|
|
|
|
|
|
|
|
|
|
|
<canvas id="bar-chart" width=300" height="150"></canvas>
|
2018-09-24 07:55:20 +08:00
|
|
|
|
|
2018-09-07 11:20:14 +08:00
|
|
|
|
<script>
|
|
|
|
|
|
|
|
|
|
|
|
new Chart(document.getElementById("bar-chart"), {
|
|
|
|
|
|
type: 'bar',
|
|
|
|
|
|
data: {
|
|
|
|
|
|
labels: ["North America", "Latin America", "Europe", "Asia", "Africa"],
|
|
|
|
|
|
datasets: [
|
|
|
|
|
|
{
|
|
|
|
|
|
label: "Number of developers (millions)",
|
|
|
|
|
|
backgroundColor: ["red", "blue","yellow","green","pink"],
|
|
|
|
|
|
data: [7,4,6,9,3]
|
|
|
|
|
|
}
|
|
|
|
|
|
]
|
|
|
|
|
|
},
|
|
|
|
|
|
options: {
|
|
|
|
|
|
legend: { display: false },
|
|
|
|
|
|
title: {
|
|
|
|
|
|
display: true,
|
|
|
|
|
|
text: 'Number of Developers in Every Continent'
|
|
|
|
|
|
},
|
|
|
|
|
|
|
|
|
|
|
|
scales: {
|
|
|
|
|
|
yAxes: [{
|
|
|
|
|
|
ticks: {
|
|
|
|
|
|
beginAtZero:true
|
|
|
|
|
|
}
|
|
|
|
|
|
}]
|
|
|
|
|
|
}
|
|
|
|
|
|
|
|
|
|
|
|
}
|
|
|
|
|
|
|
|
|
|
|
|
});
|
|
|
|
|
|
</script>
|
|
|
|
|
|
|
|
|
|
|
|
</body>
|
|
|
|
|
|
</html>
|
|
|
|
|
|
```
|
|
|
|
|
|
|
2018-09-24 07:55:20 +08:00
|
|
|
|
如你所见,通过设置 `type` 和 `bar` 来构造条形图。你可以把条形体的方向改成其他类型 —— 比如把 `type` 设置成 `horizontalBar`。
|
2018-09-07 11:20:14 +08:00
|
|
|
|
|
2018-09-24 07:55:20 +08:00
|
|
|
|
在 `backgroundColor` 数组参数中提供颜色类型,就可以设置条形图的颜色。
|
2018-09-07 11:20:14 +08:00
|
|
|
|
|
2018-09-23 15:12:16 +08:00
|
|
|
|
颜色被分配给关联数组中相同索引的标签和数据。例如,第二个标签 “Latin American”,颜色会是 “蓝色(blue)”(第二个颜色),数值是 4(data 中的第二个数字)。
|
2018-09-07 11:20:14 +08:00
|
|
|
|
|
2018-09-23 15:12:16 +08:00
|
|
|
|
代码的执行结果如下。
|
2018-09-07 11:20:14 +08:00
|
|
|
|
|
|
|
|
|
|

|
|
|
|
|
|
|
2018-09-24 07:55:20 +08:00
|
|
|
|
### 2、 Chartist.js
|
2018-09-07 11:20:14 +08:00
|
|
|
|
|
2018-09-23 15:12:16 +08:00
|
|
|
|
[Chartist.js][2] 是一个简单的 JavaScript 动画库,你能够自制美丽的响应式图表,或者进行其他创作。使用它需要遵循 WTFPL 或者 MIT 协议。
|
2018-09-07 11:20:14 +08:00
|
|
|
|
|
2018-09-23 15:12:16 +08:00
|
|
|
|
这个库是由一些对现有图表工具不满的开发者进行开发的,它可以为设计师或程序员提供美妙的功能。
|
2018-09-07 11:20:14 +08:00
|
|
|
|
|
2018-09-23 15:12:16 +08:00
|
|
|
|
在项目中包含 Chartist.js 库后,你可以使用它们来创建各式各样的图表,包括动画,条形图和折线图。它使用 SVG 来动态渲染图表。
|
2018-09-07 11:20:14 +08:00
|
|
|
|
|
2018-09-24 07:55:20 +08:00
|
|
|
|
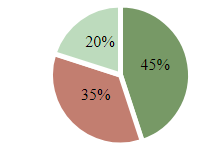
这里是使用该库绘制一个饼图的例子。
|
|
|
|
|
|
|
2018-09-07 11:20:14 +08:00
|
|
|
|
```
|
|
|
|
|
|
<!DOCTYPE html>
|
|
|
|
|
|
<html>
|
|
|
|
|
|
<head>
|
|
|
|
|
|
|
|
|
|
|
|
<link href="https//cdn.jsdelivr.net/chartist.js/latest/chartist.min.css" rel="stylesheet" type="text/css" />
|
|
|
|
|
|
|
|
|
|
|
|
<style>
|
|
|
|
|
|
.ct-series-a .ct-slice-pie {
|
|
|
|
|
|
fill: hsl(100, 20%, 50%); /* filling pie slices */
|
|
|
|
|
|
stroke: white; /*giving pie slices outline */
|
|
|
|
|
|
stroke-width: 5px; /* outline width */
|
|
|
|
|
|
}
|
|
|
|
|
|
|
|
|
|
|
|
.ct-series-b .ct-slice-pie {
|
|
|
|
|
|
fill: hsl(10, 40%, 60%);
|
|
|
|
|
|
stroke: white;
|
|
|
|
|
|
stroke-width: 5px;
|
|
|
|
|
|
}
|
|
|
|
|
|
|
|
|
|
|
|
.ct-series-c .ct-slice-pie {
|
|
|
|
|
|
fill: hsl(120, 30%, 80%);
|
|
|
|
|
|
stroke: white;
|
|
|
|
|
|
stroke-width: 5px;
|
|
|
|
|
|
}
|
|
|
|
|
|
|
|
|
|
|
|
.ct-series-d .ct-slice-pie {
|
|
|
|
|
|
fill: hsl(90, 70%, 30%);
|
|
|
|
|
|
stroke: white;
|
|
|
|
|
|
stroke-width: 5px;
|
|
|
|
|
|
}
|
|
|
|
|
|
.ct-series-e .ct-slice-pie {
|
|
|
|
|
|
fill: hsl(60, 140%, 20%);
|
|
|
|
|
|
stroke: white;
|
|
|
|
|
|
stroke-width: 5px;
|
|
|
|
|
|
}
|
|
|
|
|
|
|
|
|
|
|
|
</style>
|
|
|
|
|
|
</head>
|
|
|
|
|
|
|
|
|
|
|
|
<body>
|
|
|
|
|
|
|
|
|
|
|
|
<div class="ct-chart ct-golden-section"></div>
|
|
|
|
|
|
|
|
|
|
|
|
<script src="https://cdn.jsdelivr.net/chartist.js/latest/chartist.min.js"></script>
|
|
|
|
|
|
|
|
|
|
|
|
<script>
|
|
|
|
|
|
|
|
|
|
|
|
var data = {
|
|
|
|
|
|
series: [45, 35, 20]
|
|
|
|
|
|
};
|
|
|
|
|
|
|
|
|
|
|
|
var sum = function(a, b) { return a + b };
|
|
|
|
|
|
|
|
|
|
|
|
new Chartist.Pie('.ct-chart', data, {
|
|
|
|
|
|
labelInterpolationFnc: function(value) {
|
|
|
|
|
|
return Math.round(value / data.series.reduce(sum) * 100) + '%';
|
|
|
|
|
|
}
|
|
|
|
|
|
});
|
|
|
|
|
|
</script>
|
|
|
|
|
|
</body>
|
|
|
|
|
|
</html>
|
|
|
|
|
|
```
|
|
|
|
|
|
|
2018-09-23 15:12:16 +08:00
|
|
|
|
使用 Chartist JavaScript 库,你可以使用各种预先构建好的 CSS 样式,而不是在项目中指定各种与样式相关的部分。你可以使用这些样式来设置已创建的图表的外观。
|
2018-09-07 11:20:14 +08:00
|
|
|
|
|
2018-09-24 07:55:20 +08:00
|
|
|
|
比如,预创建的 CSS 类 `.ct-chart` 是用来构建饼状图的容器。还有 `.ct-golden-section` 类可用于获取纵横比,它基于响应式设计进行缩放,帮你解决了计算固定尺寸的麻烦。Chartist 还提供了其它类别的比例容器,你可以在自己的项目中使用它们。
|
2018-09-07 11:20:14 +08:00
|
|
|
|
|
2018-09-24 07:55:20 +08:00
|
|
|
|
为了给各个扇形设置样式,可以使用默认的 `.ct-serials-a` 类。字母 `a` 是根据系列的数量变化的(a、b、c,等等),因此它与每个要设置样式的扇形相对应。
|
2018-09-07 11:20:14 +08:00
|
|
|
|
|
2018-09-24 07:55:20 +08:00
|
|
|
|
`Chartist.Pie` 方法用来创建一个饼状图。要创建另一种类型的图表,比如折线图,请使用 `Chartist.Line`。
|
2018-09-07 11:20:14 +08:00
|
|
|
|
|
2018-09-23 15:12:16 +08:00
|
|
|
|
代码的执行结果如下。
|
2018-09-07 11:20:14 +08:00
|
|
|
|
|
|
|
|
|
|

|
|
|
|
|
|
|
2018-09-24 07:55:20 +08:00
|
|
|
|
### 3、 D3.js
|
2018-09-07 11:20:14 +08:00
|
|
|
|
|
2018-09-24 07:55:20 +08:00
|
|
|
|
[D3.js][3] 是另一个好用的开源 JavaScript 图表库。使用它需要遵循 BSD 许可证。D3 的主要用途是,根据提供的数据,处理和添加文档的交互功能,。
|
2018-09-23 15:12:16 +08:00
|
|
|
|
|
2018-09-24 07:55:20 +08:00
|
|
|
|
借助这个 3D 动画库,你可以通过 HTML5、SVG 和 CSS 来可视化你的数据,并且让你的网站变得更精美。更重要的是,使用 D3,你可以把数据绑定到文档对象模型(DOM)上,然后使用基于数据的函数改变文档。
|
2018-09-07 11:20:14 +08:00
|
|
|
|
|
2018-09-23 15:12:16 +08:00
|
|
|
|
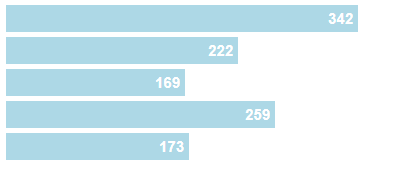
示例代码如下,它使用该库绘制了一个简单的条形图。
|
2018-09-07 11:20:14 +08:00
|
|
|
|
|
|
|
|
|
|
```
|
|
|
|
|
|
<!DOCTYPE html>
|
|
|
|
|
|
<html>
|
|
|
|
|
|
<head>
|
|
|
|
|
|
|
|
|
|
|
|
<style>
|
|
|
|
|
|
.chart div {
|
|
|
|
|
|
font: 15px sans-serif;
|
|
|
|
|
|
background-color: lightblue;
|
|
|
|
|
|
text-align: right;
|
|
|
|
|
|
padding:5px;
|
|
|
|
|
|
margin:5px;
|
|
|
|
|
|
color: white;
|
|
|
|
|
|
font-weight: bold;
|
|
|
|
|
|
}
|
|
|
|
|
|
|
|
|
|
|
|
</style>
|
|
|
|
|
|
</head>
|
|
|
|
|
|
|
|
|
|
|
|
<body>
|
|
|
|
|
|
|
|
|
|
|
|
<div class="chart"></div>
|
|
|
|
|
|
|
|
|
|
|
|
<script src="https://cdnjs.cloudflare.com/ajax/libs/d3/5.5.0/d3.min.js"></script>
|
|
|
|
|
|
|
|
|
|
|
|
<script>
|
|
|
|
|
|
|
|
|
|
|
|
var data = [342,222,169,259,173];
|
|
|
|
|
|
|
|
|
|
|
|
d3.select(".chart")
|
|
|
|
|
|
.selectAll("div")
|
|
|
|
|
|
.data(data)
|
|
|
|
|
|
.enter()
|
|
|
|
|
|
.append("div")
|
|
|
|
|
|
.style("width", function(d){ return d + "px"; })
|
|
|
|
|
|
.text(function(d) { return d; });
|
|
|
|
|
|
|
|
|
|
|
|
|
|
|
|
|
|
</script>
|
|
|
|
|
|
</body>
|
|
|
|
|
|
</html>
|
|
|
|
|
|
```
|
|
|
|
|
|
|
2018-09-23 15:12:16 +08:00
|
|
|
|
使用 D3 库的主要概念是应用 CSS 样式选择器来定位 DOM 节点,然后对其执行操作,就像其它的 DOM 框架,比如 JQuery。
|
2018-09-07 11:20:14 +08:00
|
|
|
|
|
2018-09-24 07:55:20 +08:00
|
|
|
|
将数据绑定到文档上后,.`enter()` 函数会被调用,为即将到来的数据构建新的节点。所有在 .`enter()` 之后调用的方法会为数据中的每一个项目调用一次。
|
2018-09-07 11:20:14 +08:00
|
|
|
|
|
2018-09-23 15:12:16 +08:00
|
|
|
|
代码的执行结果如下。
|
2018-09-07 11:20:14 +08:00
|
|
|
|
|
|
|
|
|
|

|
|
|
|
|
|
|
2018-09-23 15:12:16 +08:00
|
|
|
|
### 总结
|
2018-09-07 11:20:14 +08:00
|
|
|
|
|
2018-09-23 15:12:16 +08:00
|
|
|
|
[JavaScript][4] 图表库提供了强大的工具,你可以将自己的网络资源进行数据可视化。通过这三个开源库,你可以把自己的网站变得更好看,更容易使用。
|
2018-09-07 11:20:14 +08:00
|
|
|
|
|
2018-09-23 15:12:16 +08:00
|
|
|
|
你知道其它强大的用于创造 JavaScript 动画效果的前端库吗?请在下方的评论区留言分享。
|
2018-09-07 11:20:14 +08:00
|
|
|
|
|
|
|
|
|
|
|
|
|
|
|
|
--------------------------------------------------------------------------------
|
|
|
|
|
|
|
|
|
|
|
|
via: https://opensource.com/article/18/9/open-source-javascript-chart-libraries
|
|
|
|
|
|
|
|
|
|
|
|
作者:[Dr.Michael J.Garbade][a]
|
|
|
|
|
|
选题:[lujun9972](https://github.com/lujun9972)
|
2018-09-23 15:12:16 +08:00
|
|
|
|
译者:[BriFuture](https://github.com/brifuture)
|
2018-09-24 07:55:20 +08:00
|
|
|
|
校对:[wxy](https://github.com/wxy)
|
2018-09-07 11:20:14 +08:00
|
|
|
|
|
|
|
|
|
|
本文由 [LCTT](https://github.com/LCTT/TranslateProject) 原创编译,[Linux中国](https://linux.cn/) 荣誉推出
|
|
|
|
|
|
|
|
|
|
|
|
[a]: https://opensource.com/users/drmjg
|
|
|
|
|
|
[1]: https://www.chartjs.org/
|
|
|
|
|
|
[2]: https://gionkunz.github.io/chartist-js/
|
|
|
|
|
|
[3]: https://d3js.org/
|
|
|
|
|
|
[4]: https://www.liveedu.tv/guides/programming/javascript/
|